Shiba Inu price primed for 20% rally as SHIB seizes opportunity after Dogecoin’s failure
|
- Shiba Inu price has grabbed sell stops below $0.0000101, signaling a potential reversal.
- Investors can expect SHIB to trigger a 22% ascent if this outlook plays out.
- A decisive flip of the $0.0000101 level will invalidate the bullish thesis for the meme coin.
Shiba Inu price has been tightly wound between two levels since March 14. Carefully observing the movement reveals a trend to it, which suggests that SHIB is primed for a quick upswing.
As the April 20 date approached, the demand for meme coins increased, which led people to think about the original meme coin - Dogecoin. However, due to Elon Musk's lack of involvement and Dogecoin price's failure to rally, investors were disappointed. To make matters worse, Bitcoin price saw a sudden spike in selling pressure that pushed it down by 5%, which extended to 10% as the week elapsed. Regardless of the recent occurrence, Shiba Inu price looks ready for a quick uptick and could take the opportunity that Dogecoin failed.
Shiba Inu price ready to shoot higher
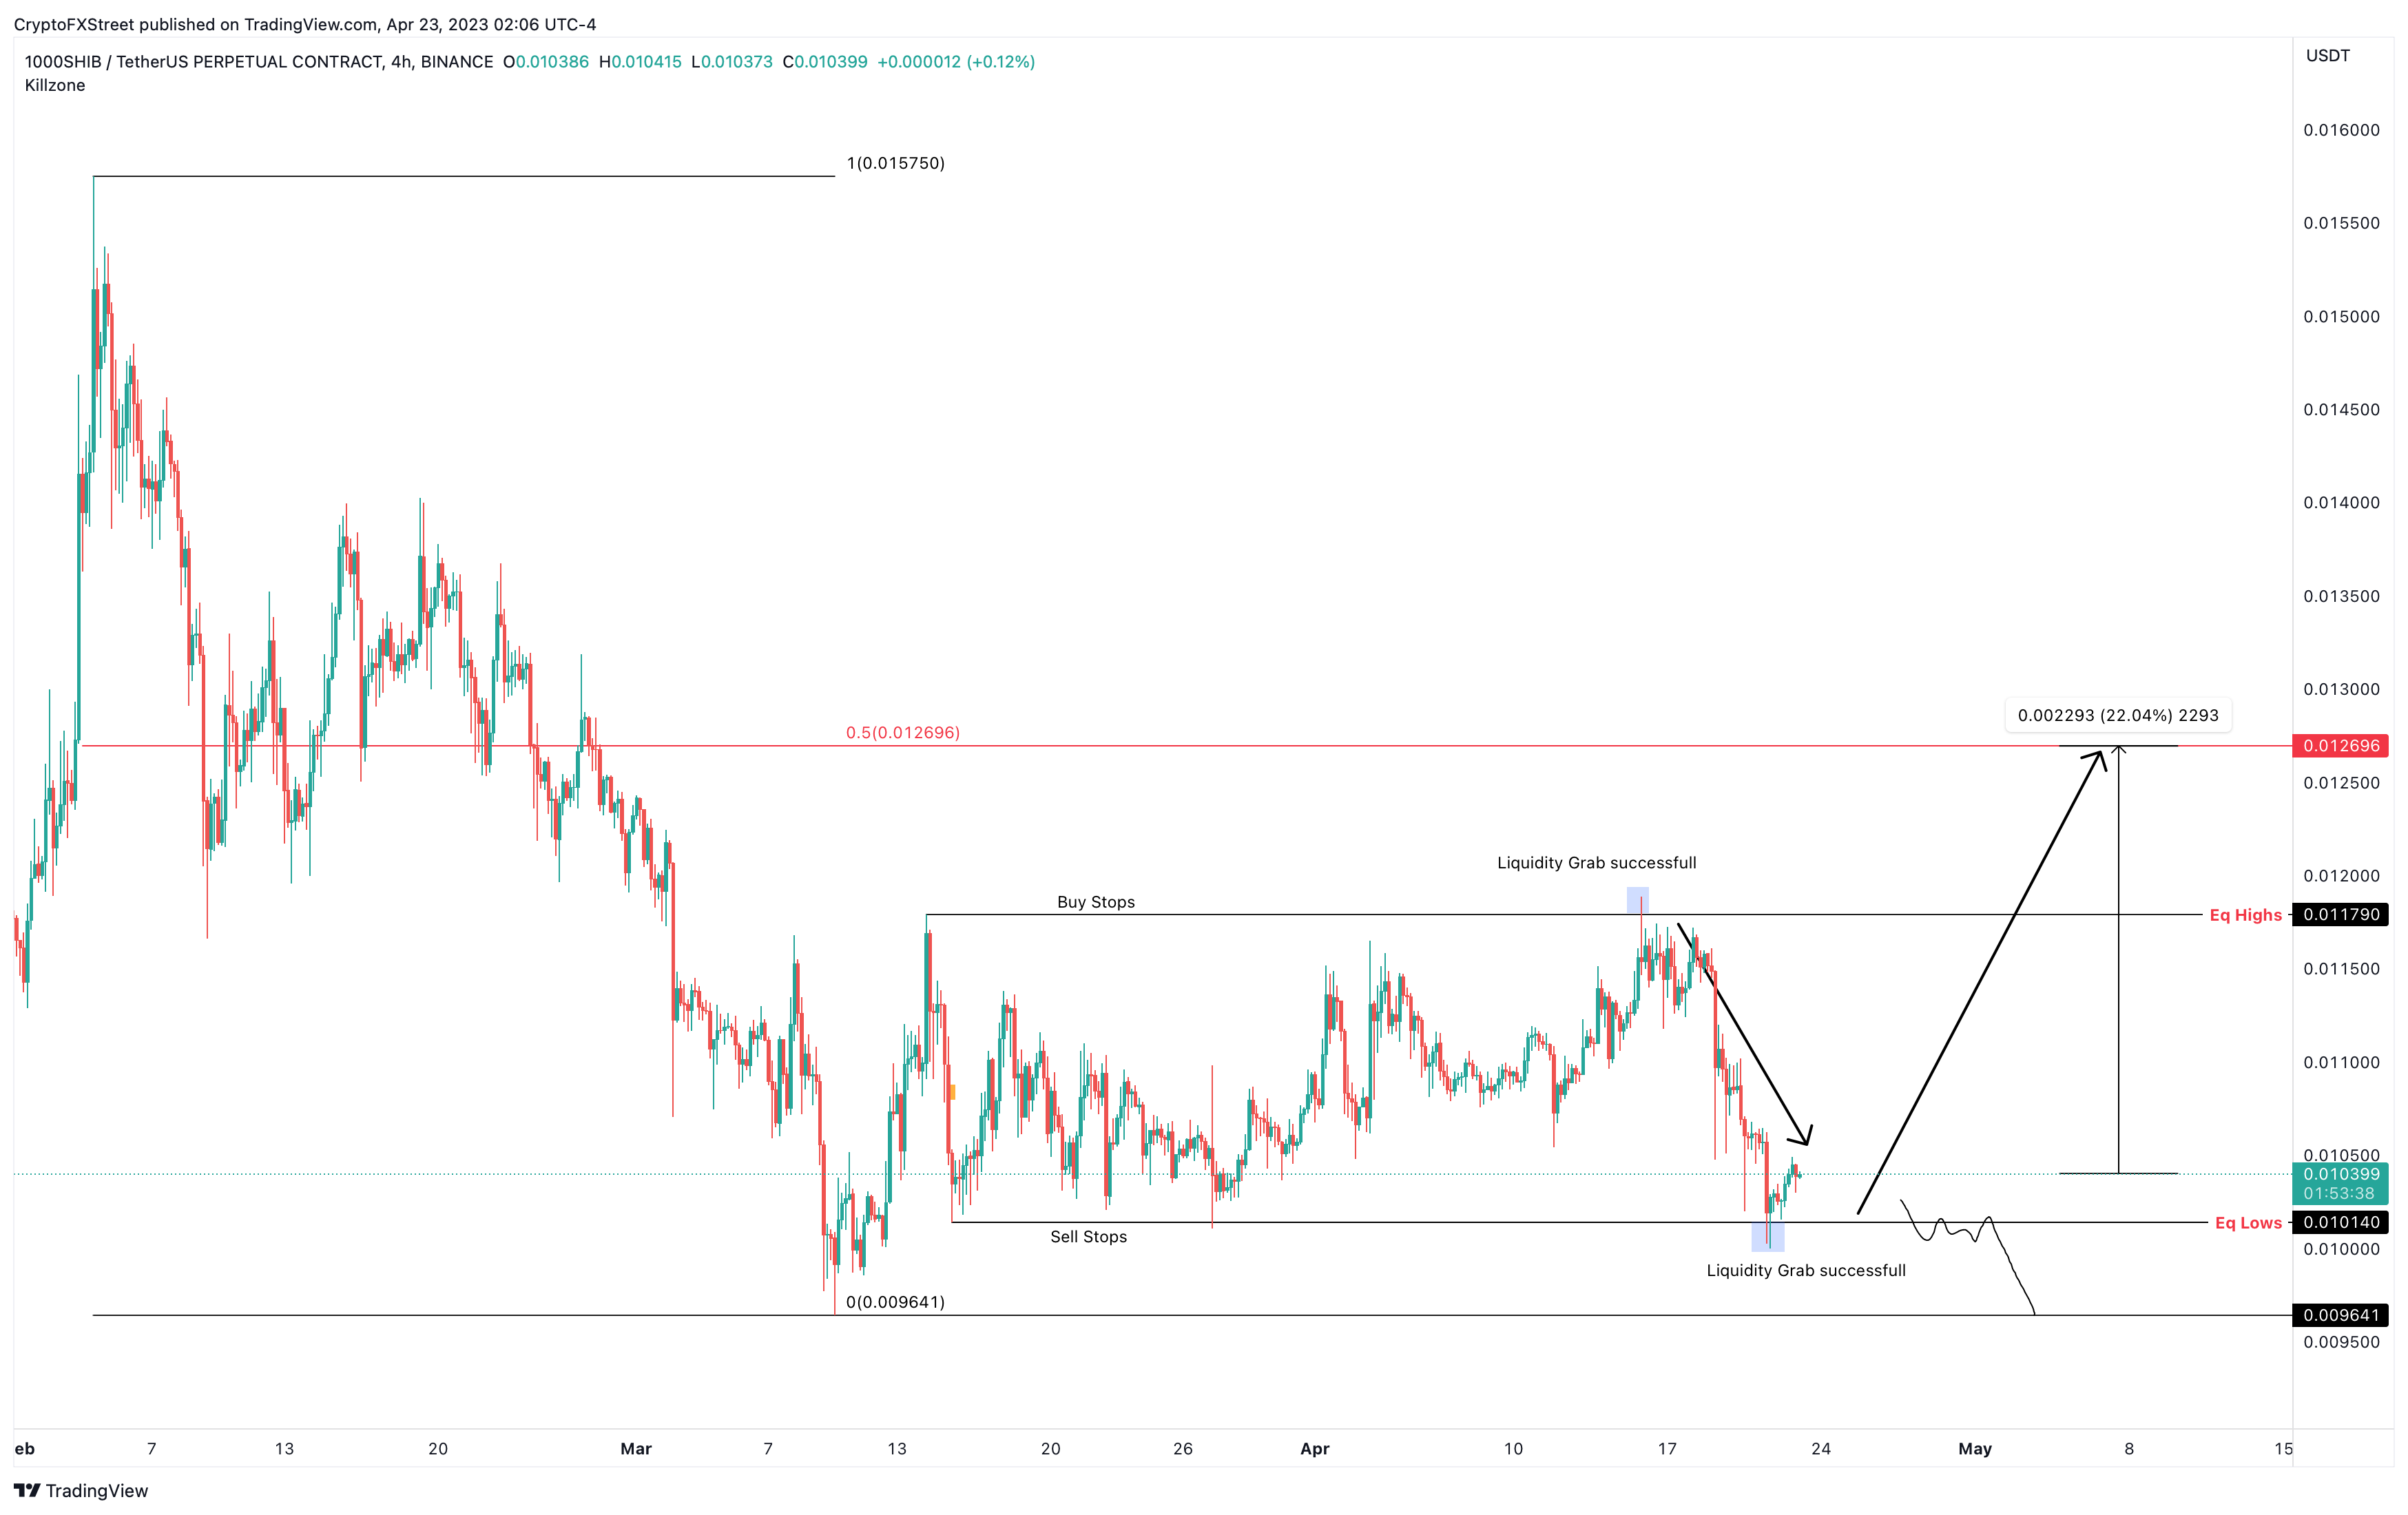
Shiba Inu price set up a local top at $0.0000157 on February 4 and shed roughly 38% in the next four weeks. This downtrend formed a bottom at $0.00000964 on March 10, and since then, SHIB has been tightly wound in a consolidation. This newly formed range extends from $0.0000101 to $0.0000117.
Careful observation reveals that liquidity sweeps are triggers for a volatile move. For example, the range high at $0.0000101 was swept on April 15 and was followed by multiple four-hour candlesticks closes below the $0.0000117 level. This buy-stop liquidity grab catalyzed a 14% downswing.
As Shiba Inu price slid lower, it swept $0.0000101 level and has rallied nearly 4% as of this writing. If history repeats, Shiba Inu price could be due for another retest of the range high at $0.0000117.
But if the buying pressure builds up and sustains, SHIB could extend higher and retest the $0.0000126 level, which is midpoint of the 38% crash between February 4 and March 10. This move would constitute a 22% ascent from the current level.
SHIB/USDT 4-hour chart
While the rally makes logical sense, things could go wrong if Shiba Inu price fails to manifest this bullish momentum. If SHIB produces a decisive four-hour candlestick close below $0.0000101 and flips it into a resistance level, it will invalidate the bullish thesis.
In such a case, Shiba Inu price could revisit the range low of the aforementioned 38% crash at $0.0000096.
Information on these pages contains forward-looking statements that involve risks and uncertainties. Markets and instruments profiled on this page are for informational purposes only and should not in any way come across as a recommendation to buy or sell in these assets. You should do your own thorough research before making any investment decisions. FXStreet does not in any way guarantee that this information is free from mistakes, errors, or material misstatements. It also does not guarantee that this information is of a timely nature. Investing in Open Markets involves a great deal of risk, including the loss of all or a portion of your investment, as well as emotional distress. All risks, losses and costs associated with investing, including total loss of principal, are your responsibility. The views and opinions expressed in this article are those of the authors and do not necessarily reflect the official policy or position of FXStreet nor its advertisers.
