Shiba Inu price likely to rise as whales accumulate
|
- Shiba Inu price is consolidating between the $0.0000296 and $0.0000207 range.
- On-chain data reflects a bullish outlook for SHIB with rising dormant wallets and a contraction in exchange supply.
- A daily candlestick close below $0.0000207 would invalidate the bullish thesis.
Shiba Inu (SHIB) price consolidation could end soon, as signaled by increased activity among previously dormant wallets and significant accumulation by whales. This surge in demand, coupled with a decreasing supply on exchanges, could potentially trigger a rally for SHIB.
Shib price eyes for a rally
Shiba Inu price corrected 60% from its local top at $0.0000456 on March 5, after which it started consolidating between the $0.0000296 and $0.0000207 levels. SHIB is supported by the daily EMA at $0.0000232 level and has continued to bounce for the past month. If buyers are done with their accumulation, then this meme coin is likely to head north.
In its ascent, SHIB will encounter the range’s upper limit at $0.0000296, which is a key level to overcome. A successful flip of this hurdle could lead to a 10% increase that retests its previous daily resistance level at $0.0000320.
The Relative Strength Index (RSI) has recently flipped above its mean level of 50, signaling a strong bullish momentum comeback. The Awesome Oscillator (AO) shows a short-term decline in momentum as it nears a retest of its mean level of 0. If both the momentum indicators maintain their positions above their respective mean levels, it would indicate that bulls mean business.
Such an outlook could send SHIB up by an additional 13% to revisit $0.0000359, its daily resistance, on March 4. This move would constitute a 40% gain from the current position of $0.0000256.
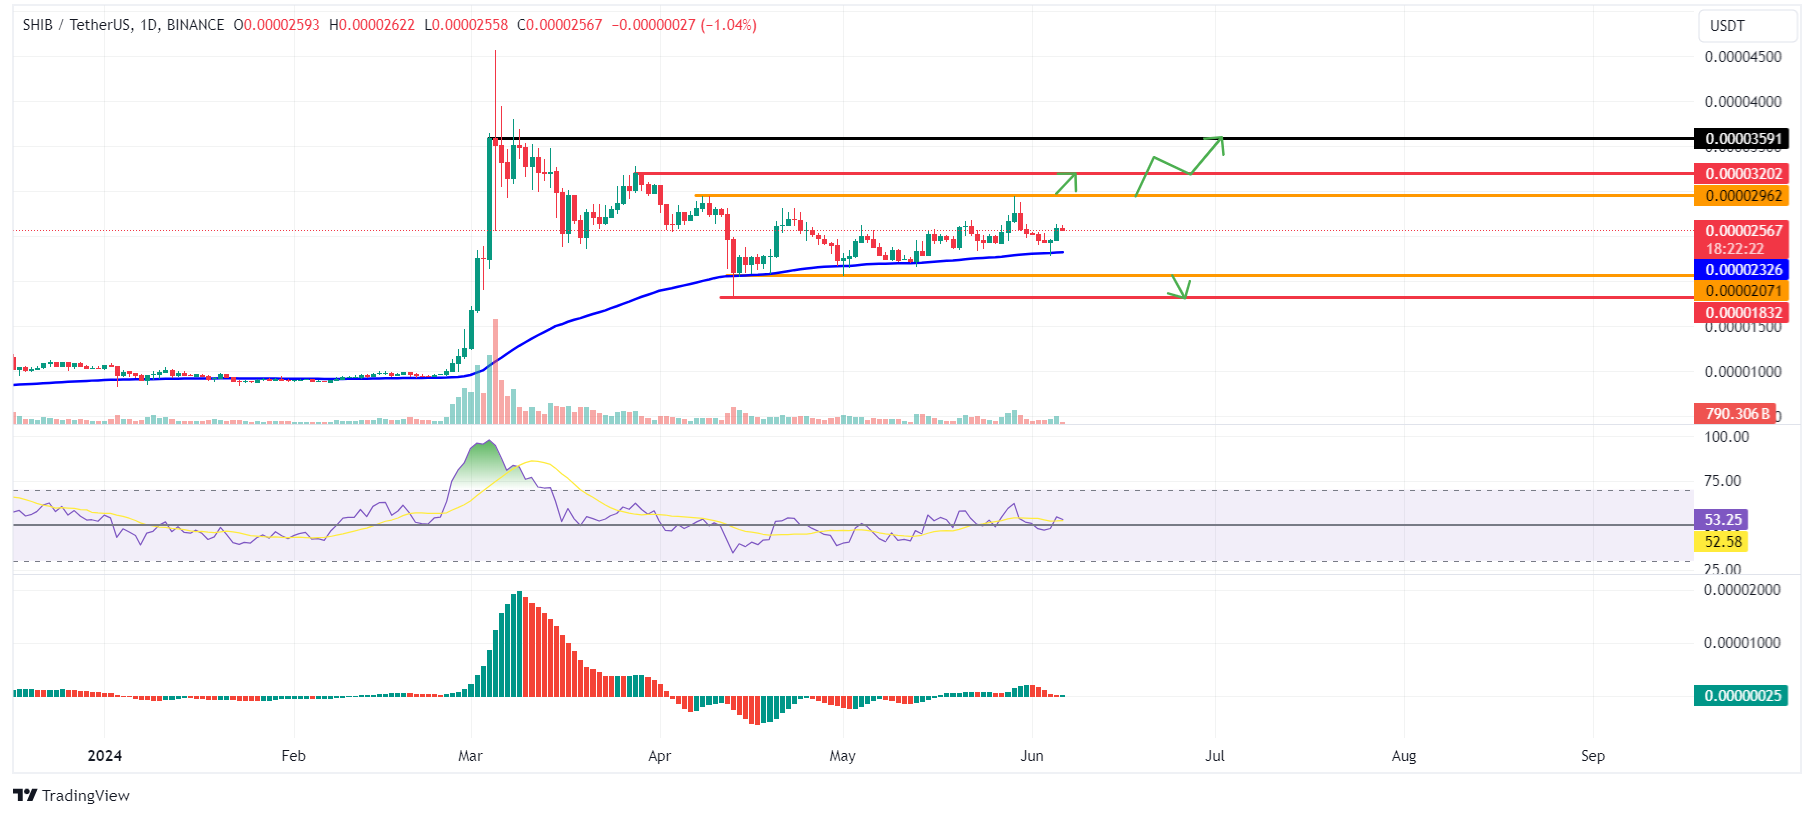
SHIB/USDT 1-day chart
Santiment’s Age Consumed index is in line with the bullish outlook noted from a technical perspective. The spikes in this index suggest dormant tokens (tokens stored in wallets for a long time) are in motion and can be used to spot short-term local tops or bottoms.
In SHIB’s case, history shows that the spikes were followed by a rally in Shiba Inu price. The most recent uptick on June 4 also signals that SHIB is ready for an uptrend.
SHIB Age Consumed chart
Santiment’s Whale Transaction Count metric, which tracks transactions worth $100,000 or more, increased during the June 5 price dip, suggesting that these whales could be accumulating. On the other hand, if this index spiked after a rally, it would signal a potential reversal.
To support this analysis further, the supply of SHIB held on exchanges dropped from 76.37 trillion to 75.34 trillion in the last three days. This 1.3 % drop indicates that investors are confident in Shiba Inu's price performance and are moving out their holdings out of centralized platforms. This suggests that the holders are not looking to sell, which is a bullish signal.
SHIB Supply on Exchange chart
Despite strong technical analysis and on-chain data, if the daily candlestick closes below the daily support at $0.0000207, then Shiba Inu price will form a lower low on the daily time frame, indicating a bearish market structure. Thus, the bullish thesis would be invalidated, triggering a potential 12% crash to $0.0000183.
Information on these pages contains forward-looking statements that involve risks and uncertainties. Markets and instruments profiled on this page are for informational purposes only and should not in any way come across as a recommendation to buy or sell in these assets. You should do your own thorough research before making any investment decisions. FXStreet does not in any way guarantee that this information is free from mistakes, errors, or material misstatements. It also does not guarantee that this information is of a timely nature. Investing in Open Markets involves a great deal of risk, including the loss of all or a portion of your investment, as well as emotional distress. All risks, losses and costs associated with investing, including total loss of principal, are your responsibility. The views and opinions expressed in this article are those of the authors and do not necessarily reflect the official policy or position of FXStreet nor its advertisers.