Shiba Inu is poised for a rally as price action and on-chain metrics signal bullish momentum
|
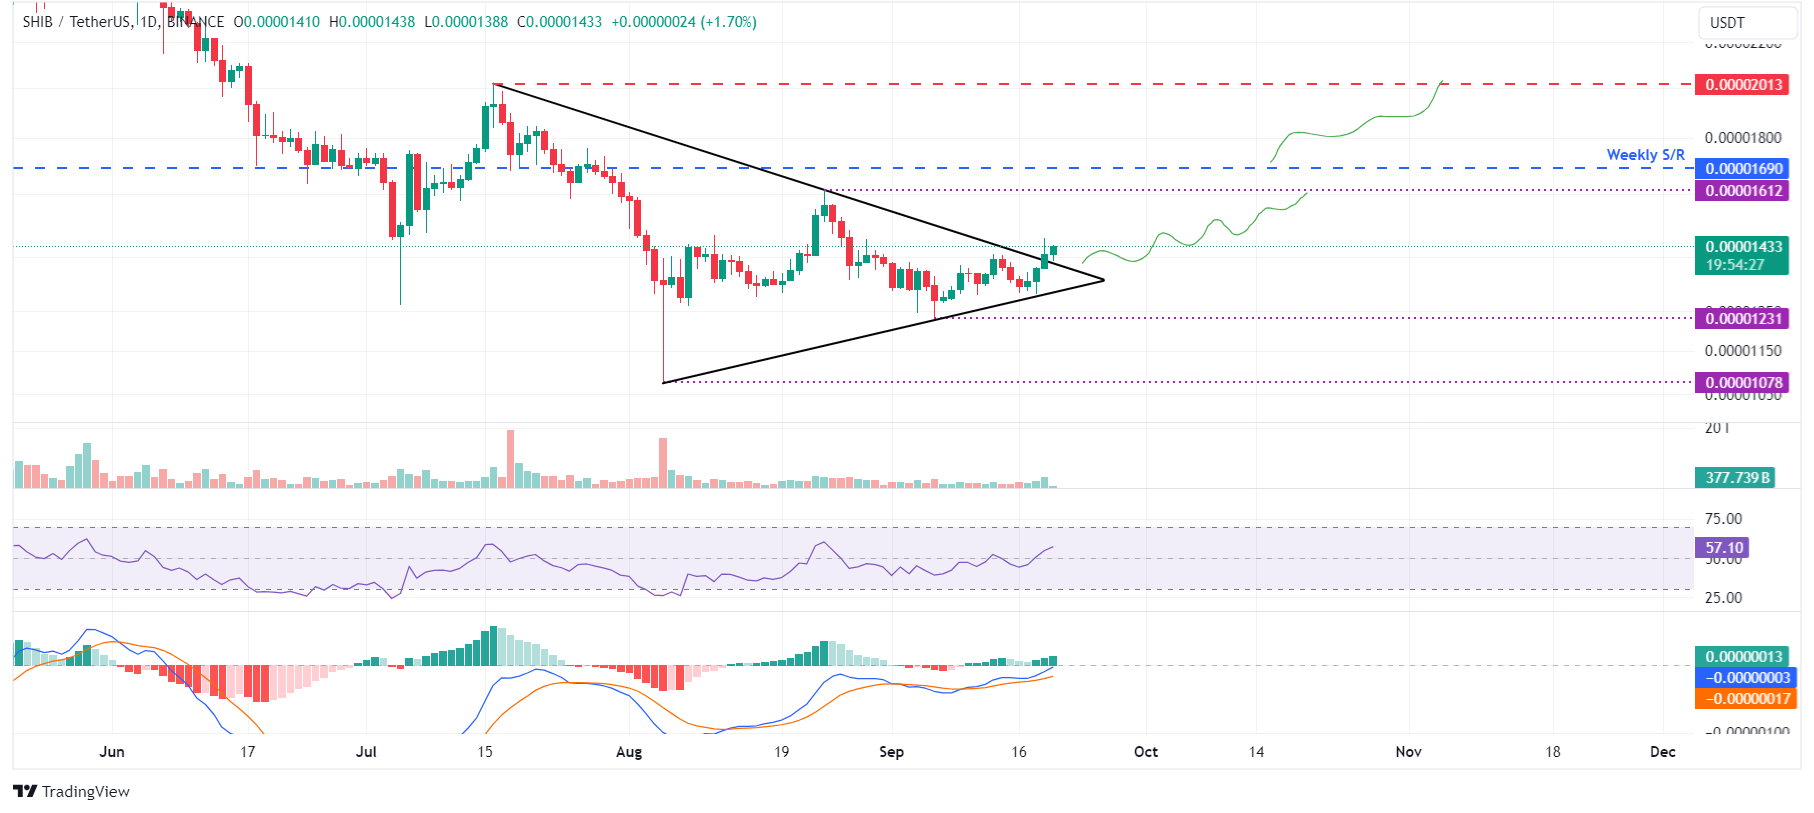
- Shiba Inu price breaks above the symmetrical triangle pattern, signaling a bullish move ahead.
- On-chain data paints a bullish picture as SHIB’s daily new transactions increase.
- A daily candlestick close below $0.000012 would invalidate the bullish thesis.
Shiba Inu (SHIB) remains strong on Friday after breaking above a symmetrical triangle pattern on Thursday. This breakout signals bullish momentum, further bolstered by a rise in daily new transactions that suggests a potential rally in the coming days.
Shiba Inu is set for an upsurge after breaking above symmetrical triangle pattern
Shiba Inu price was training inside a symmetrical triangle pattern and broke above it on Thursday. This pattern is formed by connecting multiple high and low levels with two converging trendlines (from mid-July to mid-September); breaking above this pattern favors the bulls. As of Friday, it continues to trade above around $0.000014.
If the upper trendline of the symmetrical triangle around $0.000013 holds as support, SHIB could rally 15% to retest the August 24 high of $0.000016.
The Moving Average Convergence Divergence (MACD) indicator further supports SHIB’s rise, signaling a bullish crossover on the daily chart. The MACD line (blue line) moved above the signal line (yellow line), giving a buy signal. It shows rising green histogram bars above the neutral zero line, also suggesting that the Shiba Inu price could experience upward momentum.
Furthermore, the Relative Strength Index (RSI) trades above its neutral level of 50, indicating bullish momentum.
If the bulls are aggressive and the overall crypto market outlook is positive, Shiba Inu could close above the weekly resistance of $0.000016. It could extend an additional 20% rally to retest its July 16 high of $0.000020.
SHIB/USDT daily chart
IntoTheBlock’s In/Out of the Money Around Price (IOMAP) further supports the bullish outlook. Nearly 10,580 addresses accumulated 44.45 trillion SHIB tokens at an average price of $0.000014. These addresses bought the dog-based meme token at the $0.000014 level, which makes it a key support zone.
Interestingly, the $0.000014 level, from a technical analysis perspective, coincides with the IOMAP findings, making this zone a key reversal level to watch.
SHIB IOMAP chart
According to Shibarium Scan, daily new transactions align with the bullish outlook. The new transactions increased from 3,090 on Monday to 11,357 on Thursday, the highest in one month. This transaction surge suggests that investors’ interest and activity in Shiba Inu Blockchain usage are rising, bolstering the bullish outlook for the dog-based meme token.
SHIB New transactions chart
Despite the bullish outlook suggested by the technical analysis and on-chain metrics, if Shiba Inu’s daily candlestick breaks below the lower trendline and closes below $0.000012, the bullish thesis would be invalidated. In such a case, SHIB’s price would extend a decline by 12% to retest its September 6 low of $0.000010.
Information on these pages contains forward-looking statements that involve risks and uncertainties. Markets and instruments profiled on this page are for informational purposes only and should not in any way come across as a recommendation to buy or sell in these assets. You should do your own thorough research before making any investment decisions. FXStreet does not in any way guarantee that this information is free from mistakes, errors, or material misstatements. It also does not guarantee that this information is of a timely nature. Investing in Open Markets involves a great deal of risk, including the loss of all or a portion of your investment, as well as emotional distress. All risks, losses and costs associated with investing, including total loss of principal, are your responsibility. The views and opinions expressed in this article are those of the authors and do not necessarily reflect the official policy or position of FXStreet nor its advertisers.