SafeMoon finds support, positions for return to $0.000007
|
- SafeMoon price has been the definition of what whipsaws in trading cryptocurrencies look like.
- Profit-taking and mean reversion traders smash SafeMoon lower as the market battles for equilibrium.
- The road to $0.000007 may be difficult but not insurmountable.
SafeMoon price has retraced more than 46% from the new all-time highs established on October 29th. SafeMoon remains 40% below its all-time highs. A strong confluence zone of support may limit and further selling pressure.
SafeMoon price dives nearly 50% and finds support
SafeMoon price is at an inflection point. A massive gap between the top of the Cloud (Senkou Span B) and the Kijun-Sen indicates that any move below the Kijun-Sen could trigger intense selling pressure to test Senkou Span B as support. However, support does exist between those two Ichimoku levels.
The 50% Fibonacci retracement drawn from the all-time high to the low of the weekly strong bar is at $0.0000039. Sharing that value area is the weekly Tenkan-Sen (blue, horizontal ray) at $0.0000040. SafeMoon price has bounced off the 50% Fibonacci retracement four times in the past six days. How likely is this confluence zone to hold as support? The oscillators can give us a clue.
The Relative Strength Index remains in bull market conditions. It has yet to test the first oversold level in a bull market (50) since moving to 100, but it has bounced off 55. This indicates that momentum may continue to the upside. Additionally, the Composite Index has created a lower low and tagged extreme lows, increasing the likelihood that SafeMoon price will at least find some equilibrium at its present value area.
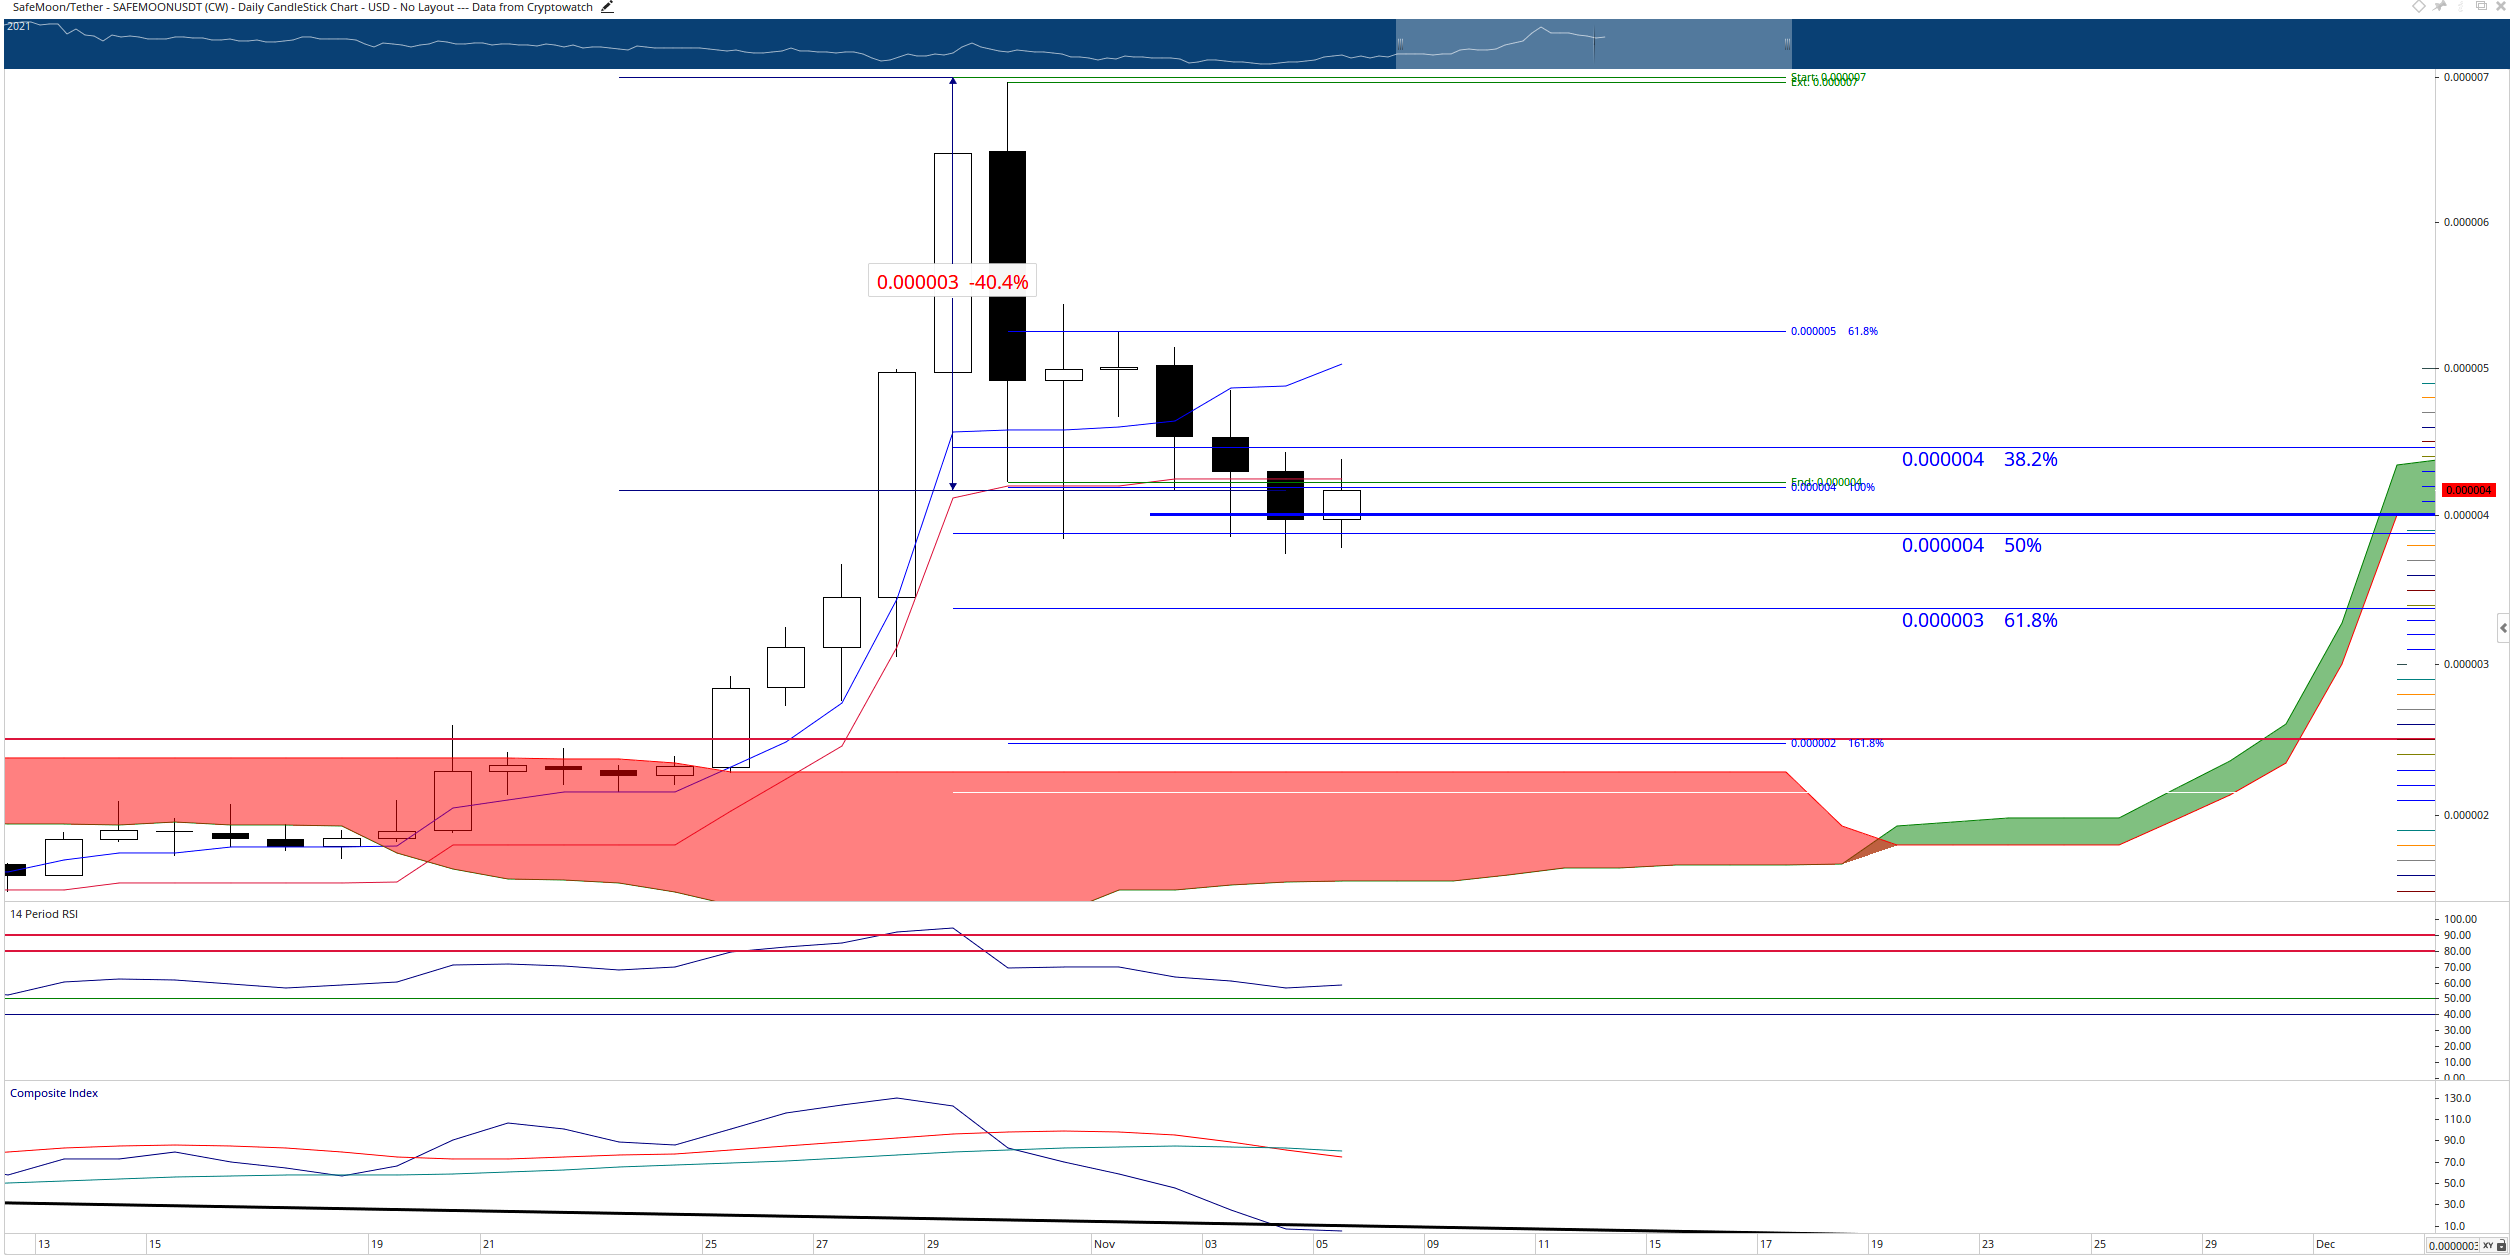
SafeMoon/USDT Daily Ichimoku Chart
Any close below the 50% Fibonacci ratio could trigger increased selling pressure for Safemoon price. The 161.8% Fibonacci expansion sits right on top of the 2021 Volume Point Of Control at $0.0000026 and above Senkou Span B at $0.0000024. If SafeMoon price can maintain support near the 50% Fibonacci retracement, the most likely scenario is a consolidative market.
Information on these pages contains forward-looking statements that involve risks and uncertainties. Markets and instruments profiled on this page are for informational purposes only and should not in any way come across as a recommendation to buy or sell in these assets. You should do your own thorough research before making any investment decisions. FXStreet does not in any way guarantee that this information is free from mistakes, errors, or material misstatements. It also does not guarantee that this information is of a timely nature. Investing in Open Markets involves a great deal of risk, including the loss of all or a portion of your investment, as well as emotional distress. All risks, losses and costs associated with investing, including total loss of principal, are your responsibility. The views and opinions expressed in this article are those of the authors and do not necessarily reflect the official policy or position of FXStreet nor its advertisers.