Ripple Price Analysis: XRP/USD bulls stay in control as upward trending line holds strong
|
- XRP/USD broke above the SMA 50.
- The 20-day Bollinger jaw has narrowed, showing decreasing price volatility.
XRP/USD daily chart
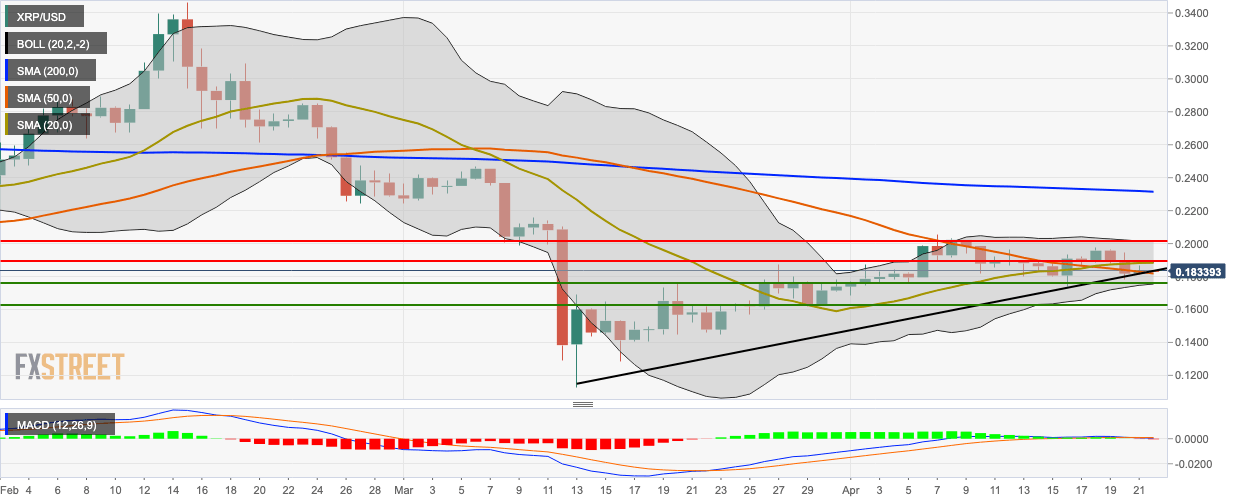
XRP/USD went up from $0.1834 to $0.1847, as the bulls remained in control of the market. The price bounced off the support provided by the upward trending line and broke above the SMA 50 curve. The 20-day Bollinger jaw has narrowed, showing decreasing price volatility. The buyers will aim to take the price above the $0.19-level and break past the SMA 20. The MACD indicates that despite the bullish price action, the overall market momentum is slightly bearish.
Key levels
Information on these pages contains forward-looking statements that involve risks and uncertainties. Markets and instruments profiled on this page are for informational purposes only and should not in any way come across as a recommendation to buy or sell in these assets. You should do your own thorough research before making any investment decisions. FXStreet does not in any way guarantee that this information is free from mistakes, errors, or material misstatements. It also does not guarantee that this information is of a timely nature. Investing in Open Markets involves a great deal of risk, including the loss of all or a portion of your investment, as well as emotional distress. All risks, losses and costs associated with investing, including total loss of principal, are your responsibility. The views and opinions expressed in this article are those of the authors and do not necessarily reflect the official policy or position of FXStreet nor its advertisers.