Recent Bitcoin price crash triggers whales to scoop BTC at discount
|
- Bitcoin price trades at $26,443 after reaching a low of $24,825 on June 15.
- The sudden crash prompted whales to take action and scoop BTC at a discount.
- Active stablecoin deposits have also spiked, showing that sidelined buyers are also interested.
Bitcoin price saw a sudden sell-off on April 19 and has been crashing since. The recent spike in bearish momentum pushed BTC down to $24,825, but an uptick in the presence of buyers has simultaneously triggered a recovery rally.
Also read: BlackRock Bitcoin ETF application, making a case for SEC approval
Bitcoin price ready to undo recent losses
Bitcoin price has dropped from a local top of $30,968 and reached a potential local bottom at $24,825 on June 15. Since then, BTC has shot up 8% and currently trades at $26,452. The chart below shows that the Relative Strength Index (RSI) has produced equal lows while BTC has set up higher lows.
This development in the momentum indicator does not signify a recovery rally in store. Additionally, the Awesome Oscillator also needs to flip above the zero line to signal a resurgence of bullish momentum.
However, should Bitcoin price kickstart a recovery bounce, the targets include the weekly Bearish Breaker extending from $29,247 to $41,273. The midpoint of this setup at $35,260 is also a key take-profit level for buyers.
For more information about bearish breakers, read this: Where will the 2023 crypto bull rally top? – ICT
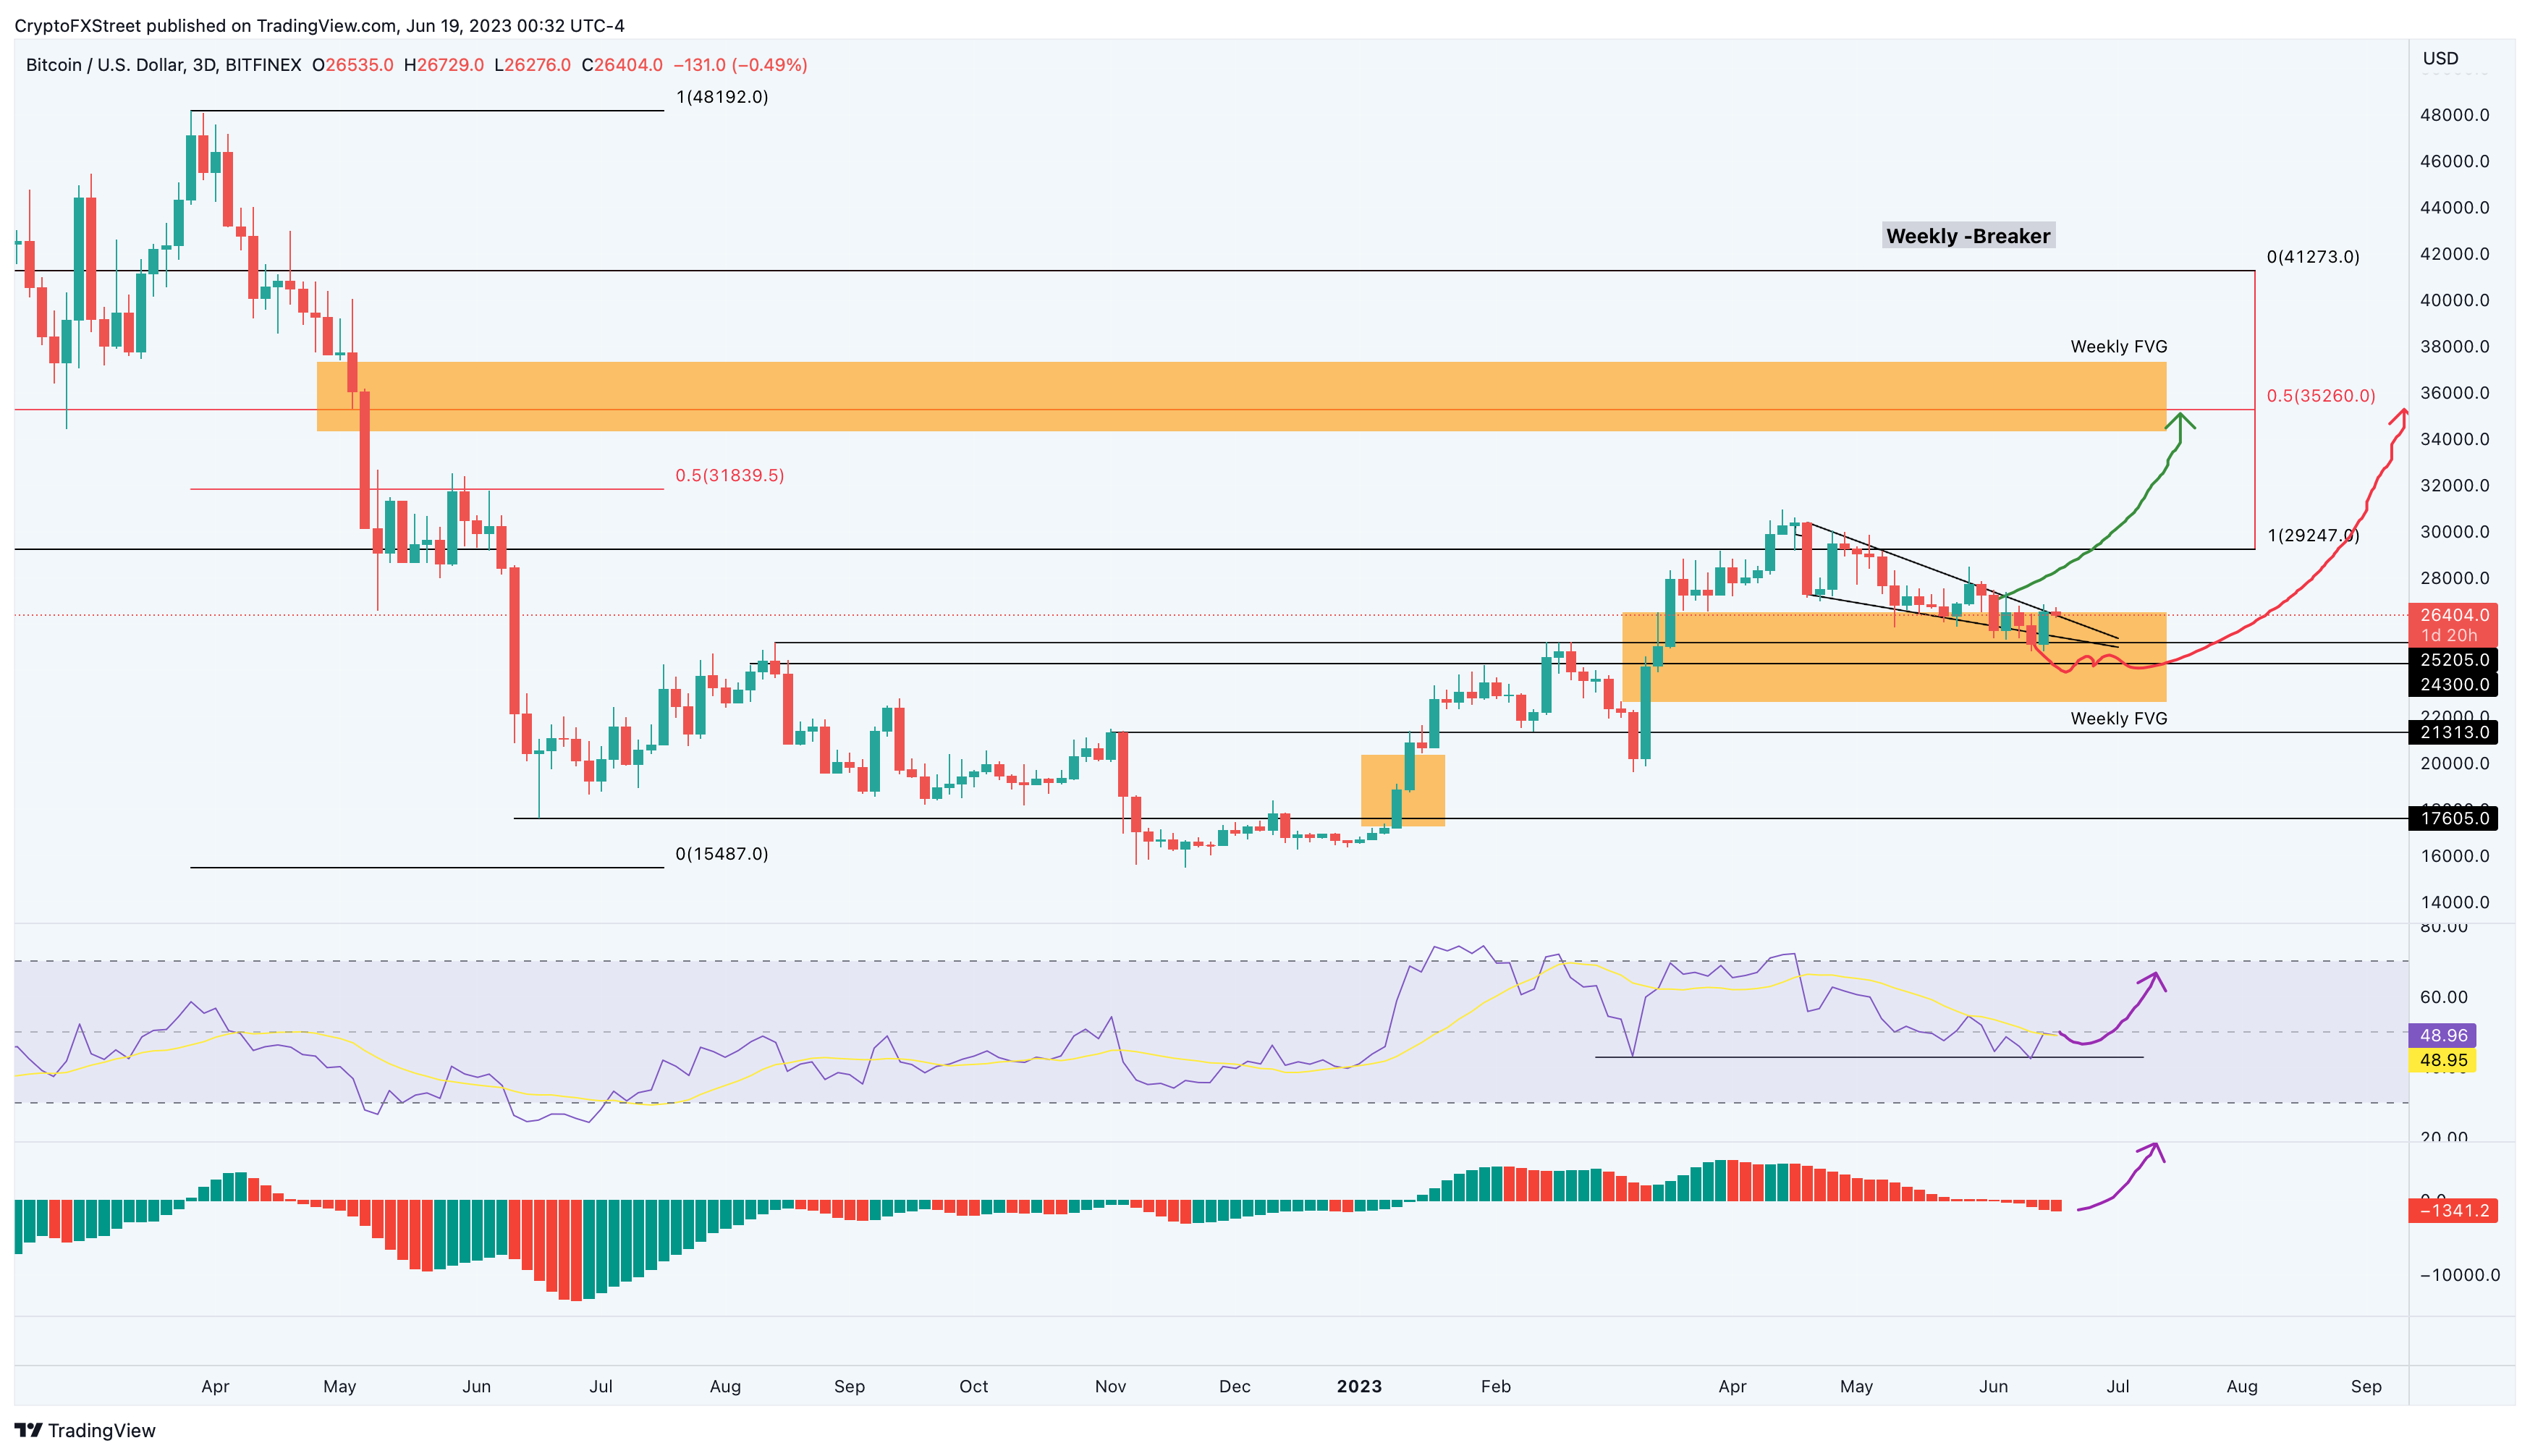
BTC/USDT 3-day chart
Supporting this rally for Bitcoin price is the Whale Transaction count, which tracks transactions worth $100,000 or more. As seen in the chart below, the yellow lines represent transfers worth $100,000 or more, and the blue lines represent transactions worth $1,000,000 or more.
As illustrated, the blue lines have seen a considerable increase on June 15, when BTC slid below the $25,000 psychological level, signaling a potential transfer to accumulate.
BTC Whale Transaction chart
Likewise, the Active Stable Deposit chart has also seen a considerable uptick since May 18, but has picked up steam after May 5. These transactions spiked from roughly 14,000 to 24,300, representing a 73.50% surge.
All of the data points to an active accumulation of BTC or preparation to accumulate should the Bitcoin price slide lower. Keeping that in mind, a retest of $24,300 to cull early bulls is possible and investors should not be surprised if this scenario occurs.
BTC Active Stablecoin Deposits
However, if Bitcoin price flips the $24,000 level into a resistance level and fails to recover, it will invalidate the bullish thesis. Such a development could potentially trigger a steep correction to the next stable support floor at roughly $21,300.
Information on these pages contains forward-looking statements that involve risks and uncertainties. Markets and instruments profiled on this page are for informational purposes only and should not in any way come across as a recommendation to buy or sell in these assets. You should do your own thorough research before making any investment decisions. FXStreet does not in any way guarantee that this information is free from mistakes, errors, or material misstatements. It also does not guarantee that this information is of a timely nature. Investing in Open Markets involves a great deal of risk, including the loss of all or a portion of your investment, as well as emotional distress. All risks, losses and costs associated with investing, including total loss of principal, are your responsibility. The views and opinions expressed in this article are those of the authors and do not necessarily reflect the official policy or position of FXStreet nor its advertisers.