Polygon’s MATIC is on the verge of a significant price movement
|
- Polygon price consolidates for a third day with lower highs and higher lows.
- As bears and bulls push towards each other, a breakout will soon unfold.
- Expect to see a bullish breakout on the back of several technical elements that could bring MATIC price to $0.90, a rally of 50%.
Polygon (MATIC) price is on the cusp of a bullish breakout once it has completed its consolidation phase. This phase is entering its third trading day as price action reveals lower highs and higher lows, and supply and demand are pushed towards one another. Considering its behaviour, it is clear that price action is underpinned, and with the Relative Strength Index (RSI) subdued, a break to the upside is the most plausible outcome, holding 50% of appreciation for MATIC price.
MATIC price sees bulls holding the cards
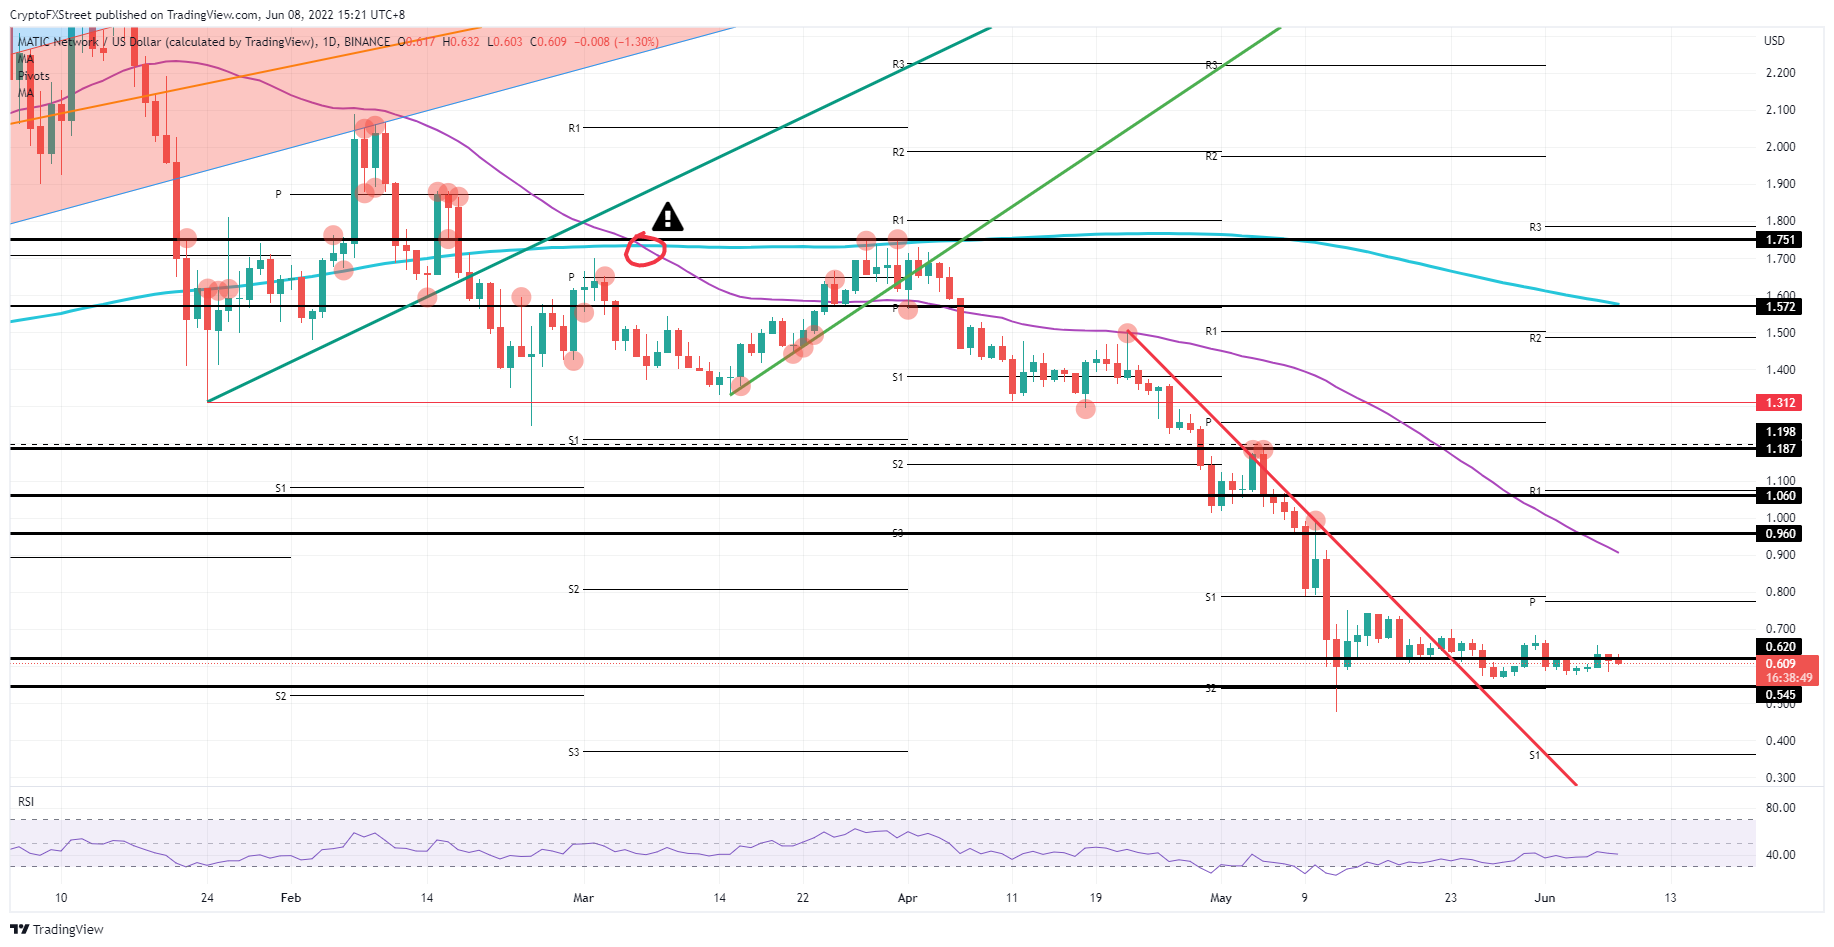
Polygon price has been trading sideways since mid-May, with no new lows – a clear sign that price action is underpinned. There is a squeeze happening, with bulls and bears drawing towards one another as supply dries up. We are getting close to the point where a breakout is likely to occur, and from the looks of it, MATIC bulls will be on the right side of the trade. RSI is still very much below 50, offering room for upside, and no new lows have been printed since May 27.
MATIC price will probably jump towards $0.80, which falls in line with the fresh monthly pivot and the previous monthly S1 support level, proving that this area or level holds technical importance. Don’t expect a break above to be easy, but once over, a continuation of the rally is a given. The leg up that follows could stretch to $0.90, with the 55-day Simple Moving Average (SMA) as a cap to the upside, not tested since the rejection on April 22.
MATIC/USD daily chart
The risk to the downside also comes from the consolidation, where bears will be using the tightness in bids and offers to swamp the price action with sell orders. That would break the supply-demand equilibrium and result in a break to the downside, with bulls fleeing the scene and pulling their orders to dry up demand. Price action would then inevitably drop towards $0.545 and possibly break towards $0.36 at the monthly S1 support level, resulting in a 40% drop overall.
Information on these pages contains forward-looking statements that involve risks and uncertainties. Markets and instruments profiled on this page are for informational purposes only and should not in any way come across as a recommendation to buy or sell in these assets. You should do your own thorough research before making any investment decisions. FXStreet does not in any way guarantee that this information is free from mistakes, errors, or material misstatements. It also does not guarantee that this information is of a timely nature. Investing in Open Markets involves a great deal of risk, including the loss of all or a portion of your investment, as well as emotional distress. All risks, losses and costs associated with investing, including total loss of principal, are your responsibility. The views and opinions expressed in this article are those of the authors and do not necessarily reflect the official policy or position of FXStreet nor its advertisers.

