Polkadot price primed for upside surge following descending trendline breakout
|
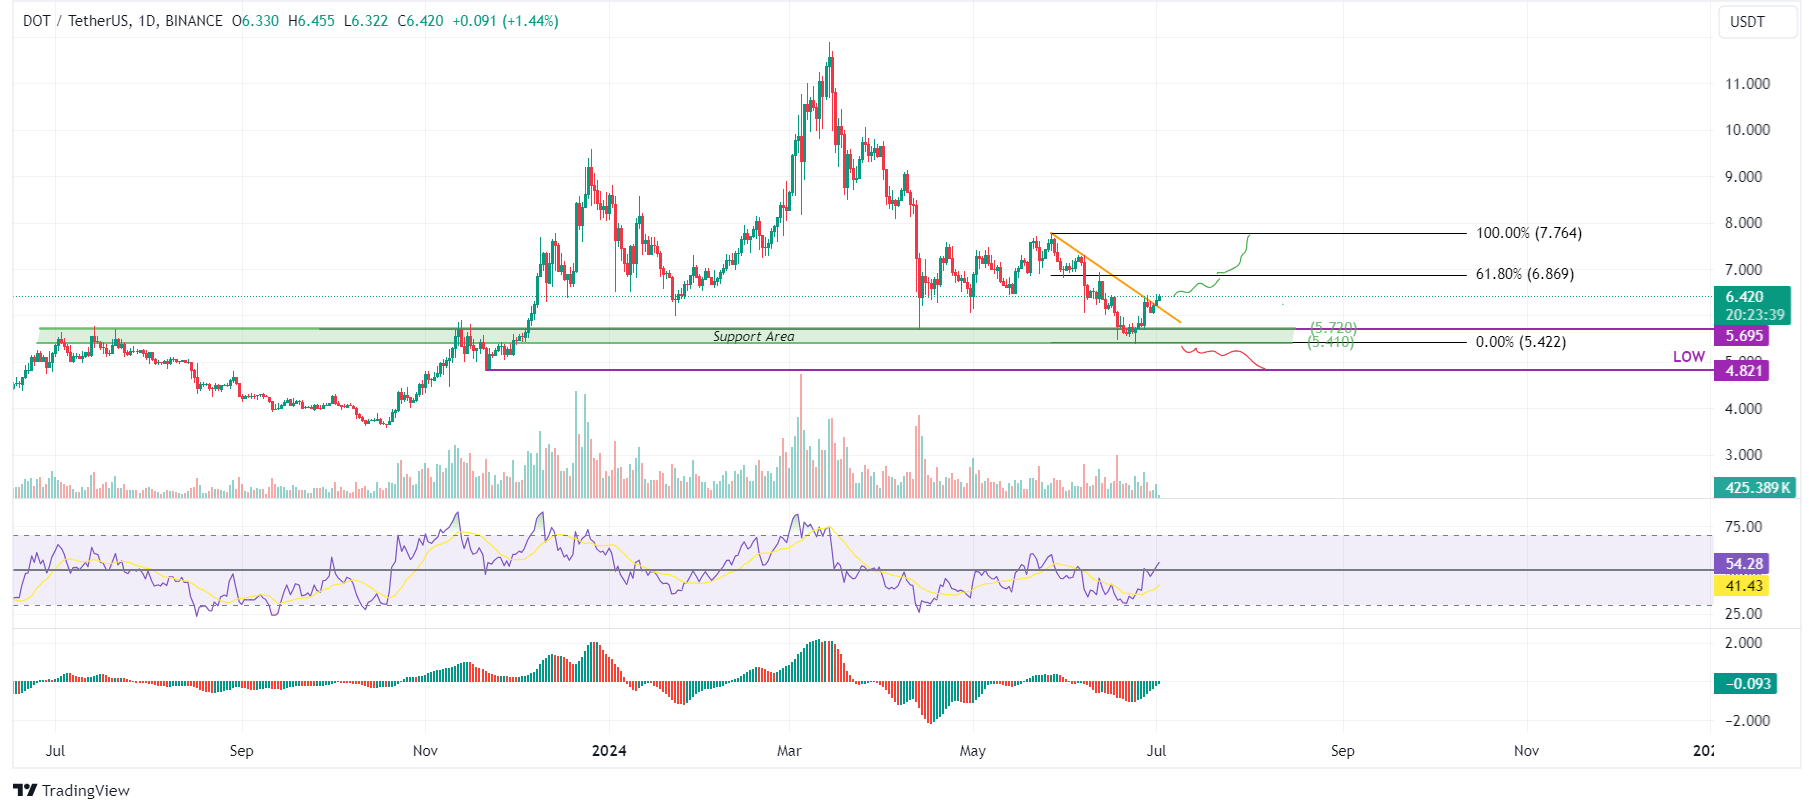
- Polkadot price breaks out of the descending trendline on Monday and trades 1.5% higher at $6.42 on Tuesday.
- Sideline buyers looking for opportunities can accumulate DOT between $5.41 and $5.72.
- A daily candlestick close below $5.41 would invalidate the bullish thesis.
Polkadot (DOT) broke out from a descending trendline on Monday, marking a 1.5% increase to $6.42 on Tuesday. Potential buyers on the sidelines eyeing opportunities can consider accumulating DOT between $5.41 and $5.72, anticipating an upcoming rally in the days ahead.
DOT price breaks out of a descending trendline
Polkadot price surged above the descending trendline on Monday and is now 1.5% higher on Tuesday, reaching $6.42. This descending trendline is drawn from joining multiple swing highs from May 27 to June 28.
If this trendline holds as pullback support, DOT price could rise 6% from its current trading level of $6.42 to retest its 61.8% Fibonacci retracement level at $6.86, drawn from a swing high in late May to a swing low in late June.
The Relative Strength Index (RSI) on the daily chart is above the neutral value of 50. However, the Awesome Oscillator (AO) indicator is still below the neutral zero level. If bulls are indeed making a comeback, then both momentum indicators must maintain their positions above their respective neutrality levels. This development would provide additional momentum to the ongoing recovery rally.
If DOT closes above $6.86, it could extend an additional rally of 13% to revisit its daily high of $7.76 from May 27.
DOT/USDT daily chart
However, if DOT's daily candlestick closes below $5.42 and establishes a lower low on the daily timeframe, it may signal a shift in market dynamics that favors bearish sentiment. Such a change could invalidate the bullish outlook, leading to a 10% decline in Polkadot’s price to retest its previous low at $4.82 from November 21, 2023.
Information on these pages contains forward-looking statements that involve risks and uncertainties. Markets and instruments profiled on this page are for informational purposes only and should not in any way come across as a recommendation to buy or sell in these assets. You should do your own thorough research before making any investment decisions. FXStreet does not in any way guarantee that this information is free from mistakes, errors, or material misstatements. It also does not guarantee that this information is of a timely nature. Investing in Open Markets involves a great deal of risk, including the loss of all or a portion of your investment, as well as emotional distress. All risks, losses and costs associated with investing, including total loss of principal, are your responsibility. The views and opinions expressed in this article are those of the authors and do not necessarily reflect the official policy or position of FXStreet nor its advertisers.