Polkadot price is poised for a 60% move, critical pattern suggests
|- Polkadot price is bounded inside a long-term symmetrical triangle pattern on the daily chart.
- The digital asset will most likely see a breakout or breakdown by the end of 2020.
Polkadot had a huge rally since it started trading in August 2020, jumping towards its all-time high at $6.8 on September 1. Since then, the digital asset has been under consolidation and now awaits a clear breakout or breakdown of its consolidation pattern, currently trading at $5.10.
Polkadot Price at a do-or-die scenario
On the daily chart, DOT has established a long symmetrical triangle pattern which seems to be close to a breakout or breakdown. On December 11, bulls defended the lower trendline support of the figure and now aim to push Polkadot price towards the upper boundary at $5.7.
DOT/USD daily chart
A breakout above the upper boundary of the symmetrical pattern would drive Polkadot price towards $8.9 in the long-term, a new all-time high. At the same time, bulls have pushed DOT above the 50-SMA, 100-SMA and 200-SMA on the 4-hour chart, turning all three into support levels.
DOT/USD 4-hour chart
Polkadot has established a 4-hour uptrend climbing above several resistance levels. The next most significant resistance point is located at $5.19. A breakout above this level would quickly push the digital asset towards $5.57.
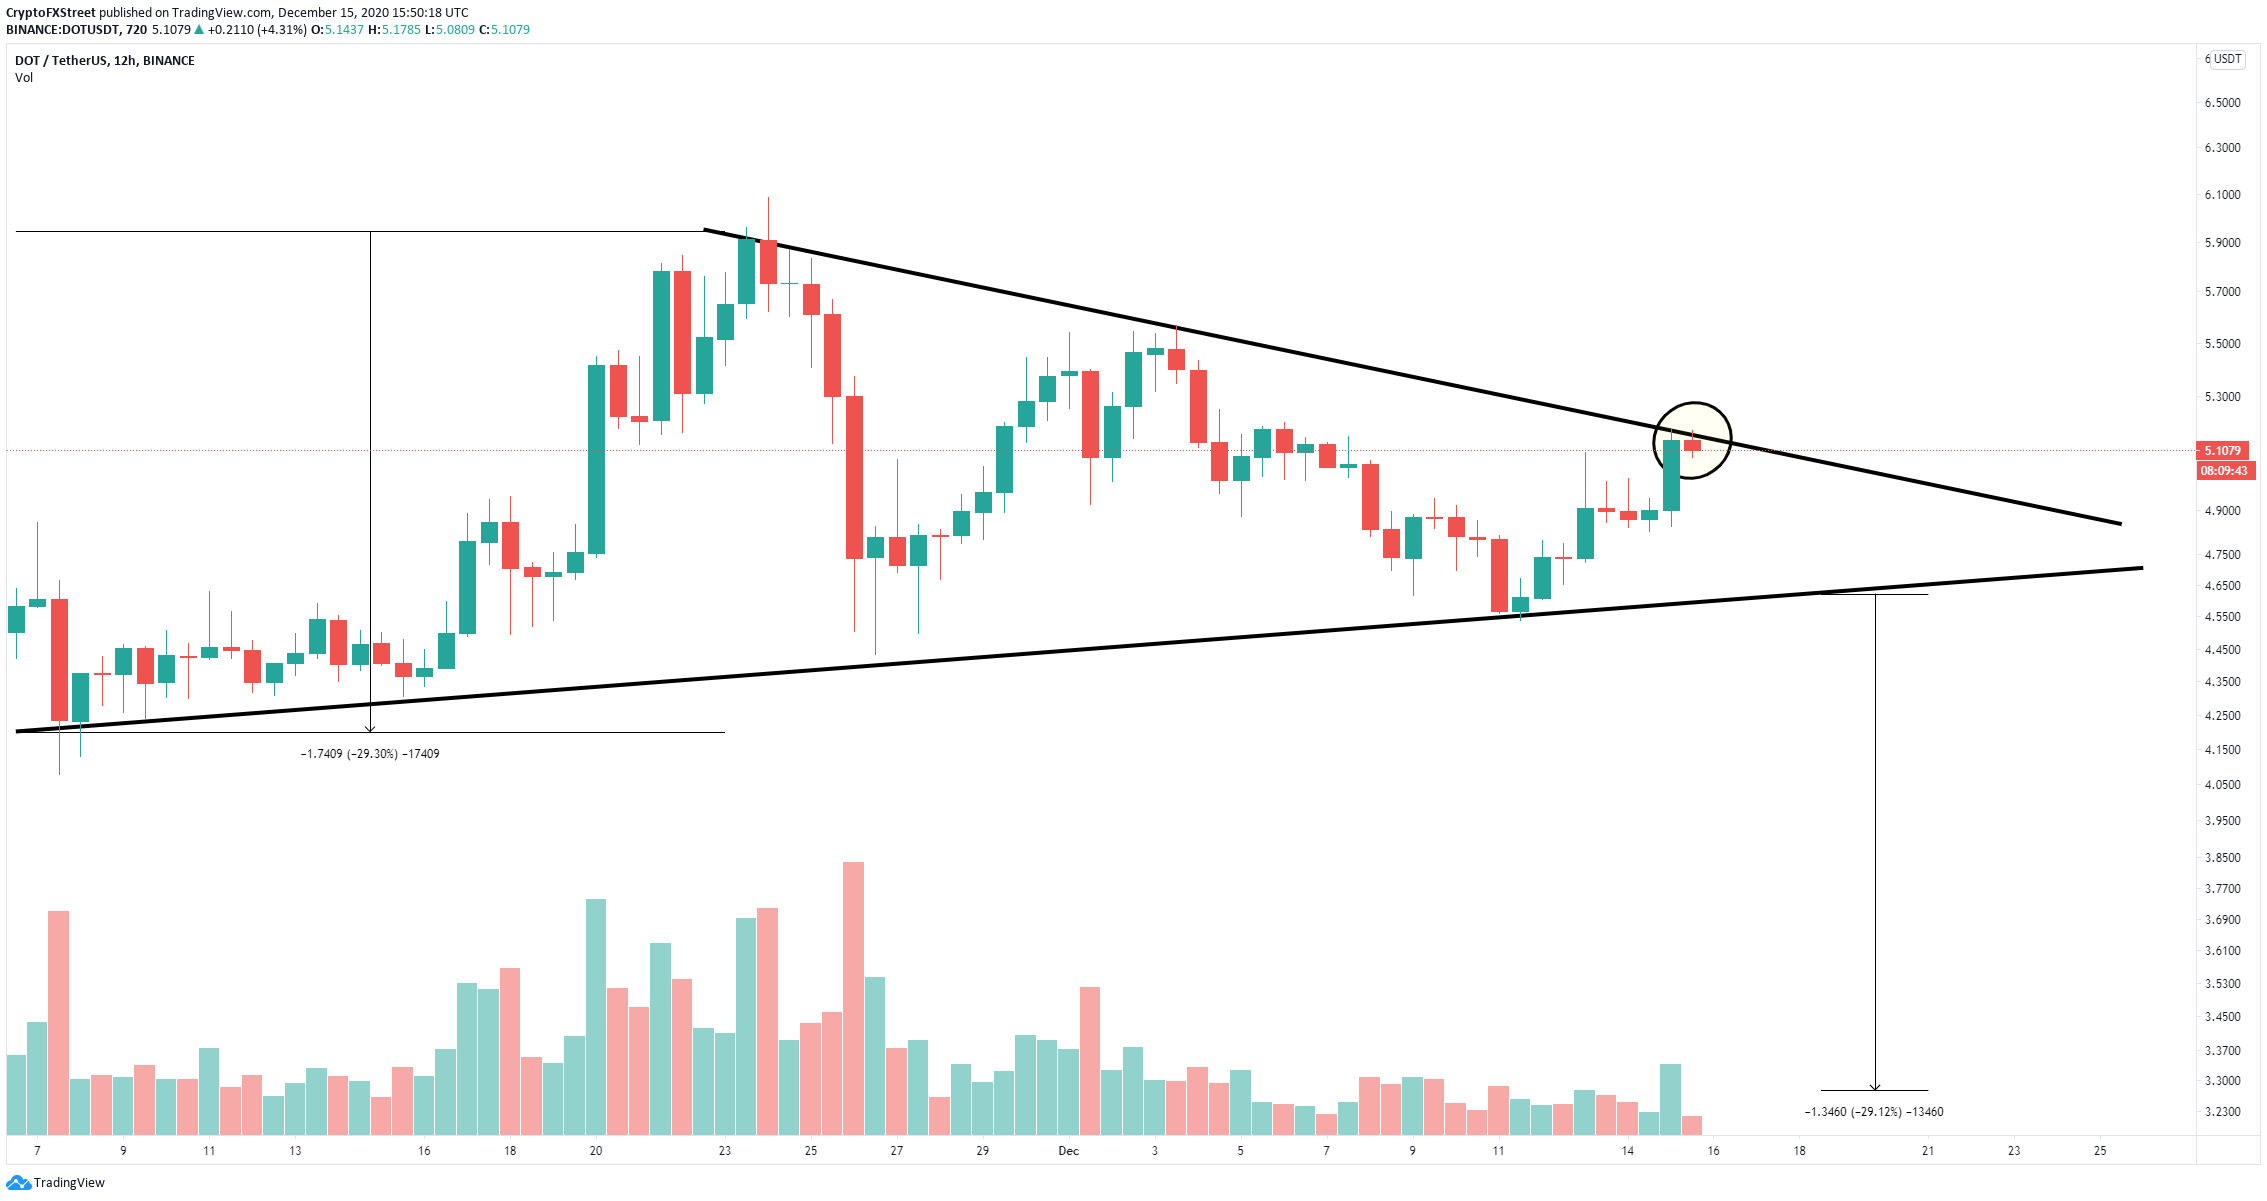
DOT/USD 12-hour chart
However, on the 12-hour chart, another short-term symmetrical triangle formed is acting as a strong resistance level. Failure to breakout above $5.19 will drive Polkadot price towards the lower trendline at $4.57. A breakdown below this point would push DOT towards $3.27 and would also represent a breakdown below the long-term triangle pattern on the daily chart, with a price target of $2.
Information on these pages contains forward-looking statements that involve risks and uncertainties. Markets and instruments profiled on this page are for informational purposes only and should not in any way come across as a recommendation to buy or sell in these assets. You should do your own thorough research before making any investment decisions. FXStreet does not in any way guarantee that this information is free from mistakes, errors, or material misstatements. It also does not guarantee that this information is of a timely nature. Investing in Open Markets involves a great deal of risk, including the loss of all or a portion of your investment, as well as emotional distress. All risks, losses and costs associated with investing, including total loss of principal, are your responsibility. The views and opinions expressed in this article are those of the authors and do not necessarily reflect the official policy or position of FXStreet nor its advertisers.