Polkadot price fractal hints at parabolic bull rally in the works
|
- Polkadot price has crashed 74% from its all-time high and is currently consolidating.
- A fractal for DOT hints that this coiling up will lead to an explosive move in the near future.
- A daily candlestick close below $15.85 will create a lower low and invalidate the bullish thesis.
Polkadot price seems to be looking for a bottom after undergoing a massive devaluation over the past four months. Interestingly, this price action seems to have led to a fractal.
Polkadot price history to repeat
Polkadot price set up a triple bottom setup in late 2020. This technical formation usually contains a swing low formation followed by a deviation below this level and a third retest, often followed by a reversal of trend favoring the bulls.
Although Polkadot price consolidated quite a bit after the triple bottom formation, it caught traction after a tiny consolidation in late December 2020. In total, the reversal setup lasted 43 days and resulted in a total of 1000% upswing over the next four months.
Interestingly, Polkadot price has produced a similar triple bottom setup of the same duration as the one formed in 2020 and hints at a similar outcome. Assuming DOT bulls manage to pull off such a run-up, investors can long DOT at the current level and expect a 100% upswing in the coming months.
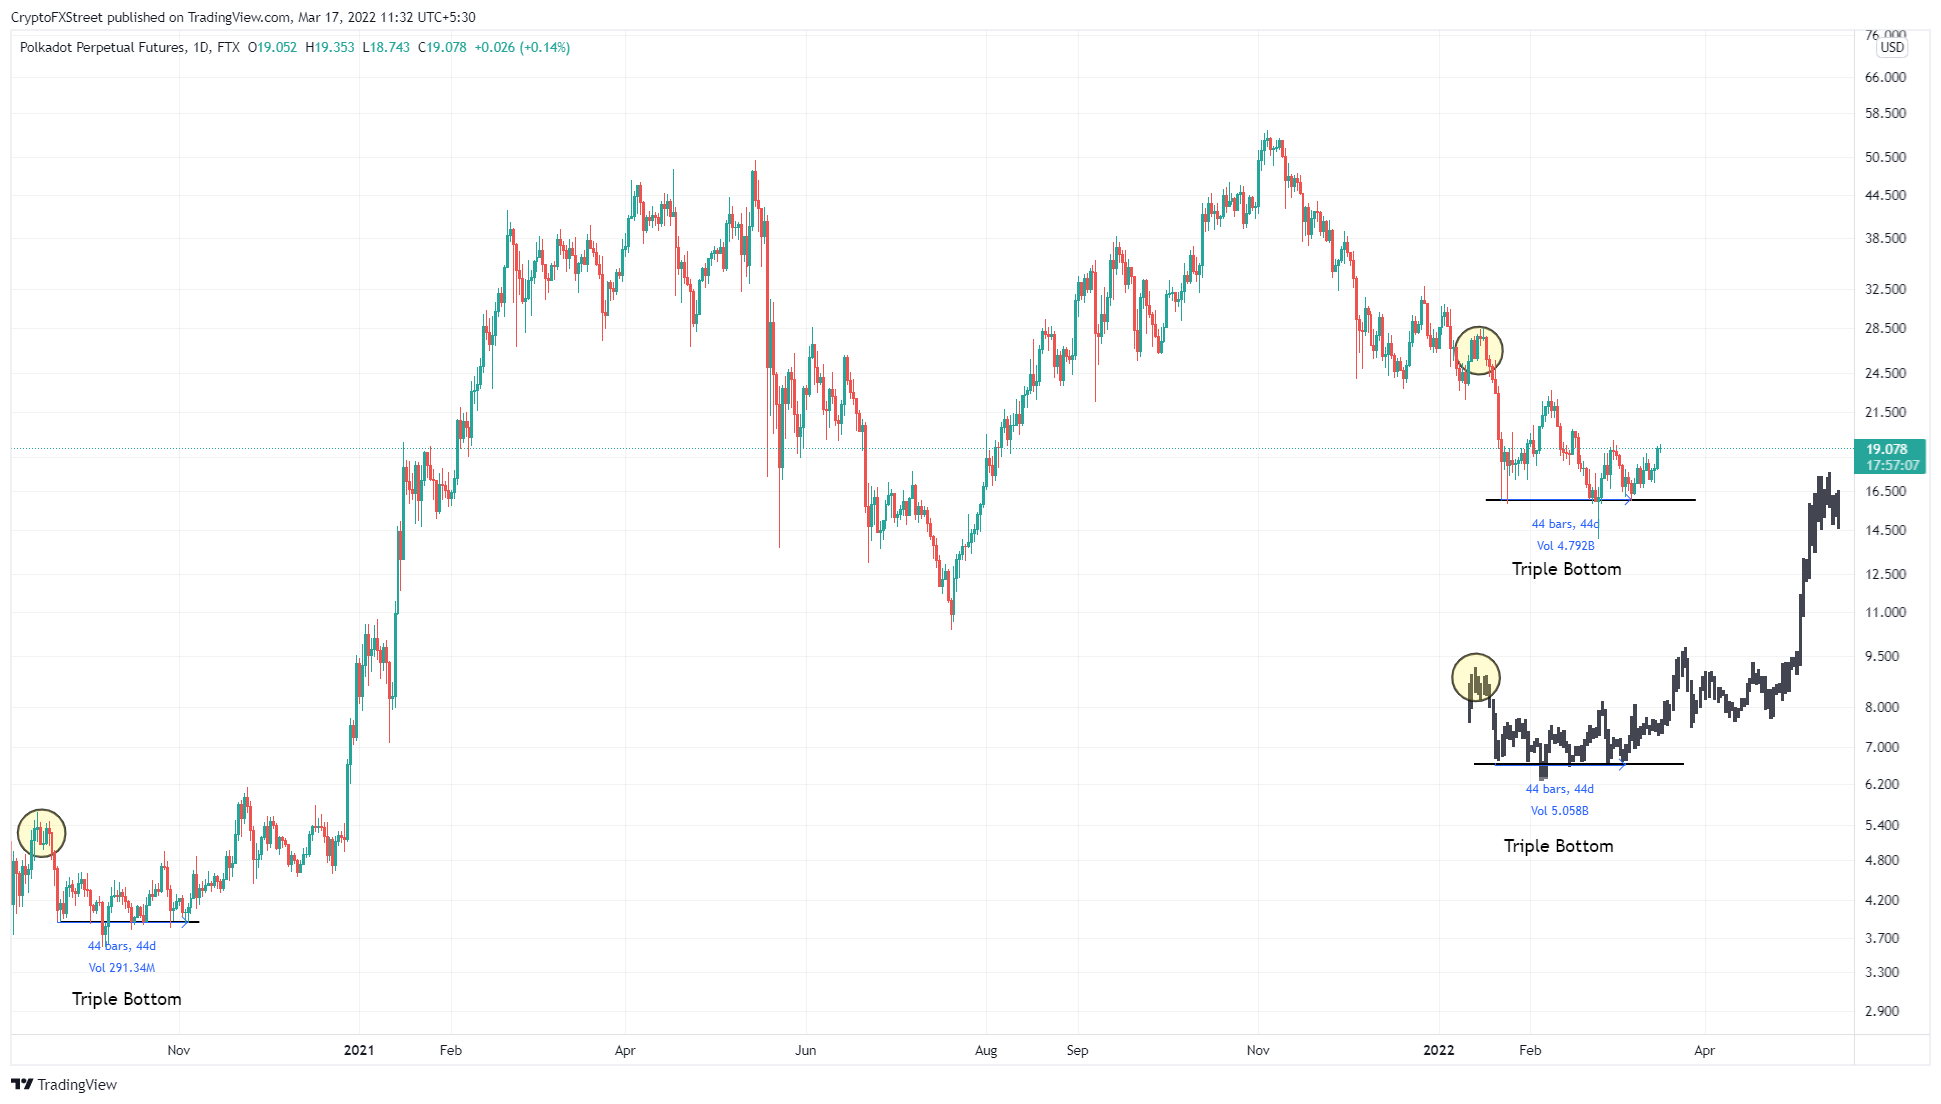
DOT/USDT 1-day chart
While the fractal is extremely bullish, Polkadot price needs to confirm it by following a similar path. Due to the high degree of uncertainty in traditional markets and the effects of interest rate hikes, however, there is a good chance this setup might turn sour.
A daily candlestick close below $15.85 will create a lower low and invalidate the bullish thesis for the Polkadot price. Such a move will open the path for bears to explore the 13.16 support level after crashing 17%.

Information on these pages contains forward-looking statements that involve risks and uncertainties. Markets and instruments profiled on this page are for informational purposes only and should not in any way come across as a recommendation to buy or sell in these assets. You should do your own thorough research before making any investment decisions. FXStreet does not in any way guarantee that this information is free from mistakes, errors, or material misstatements. It also does not guarantee that this information is of a timely nature. Investing in Open Markets involves a great deal of risk, including the loss of all or a portion of your investment, as well as emotional distress. All risks, losses and costs associated with investing, including total loss of principal, are your responsibility. The views and opinions expressed in this article are those of the authors and do not necessarily reflect the official policy or position of FXStreet nor its advertisers.