Polkadot Price Forecast: DOT steadies ahead of 40% advance
|
- Polkadot price has been setting higher highs and higher lows since the beginning of August.
- The price trend suggests that DOT is expecting a sizeable move to the upside, should it surpass the resistances ahead.
- Moving forward, a 40% surge is on the radar if Polkadot secures $25.10.
Polkadot price is slowly working its way toward a 40% climb as it continues to record higher highs and higher lows. DOT has rallied by over 116% since the July 20 low, marking a high not seen since June 21, at $23.51.
Polkadot price gears up for rally
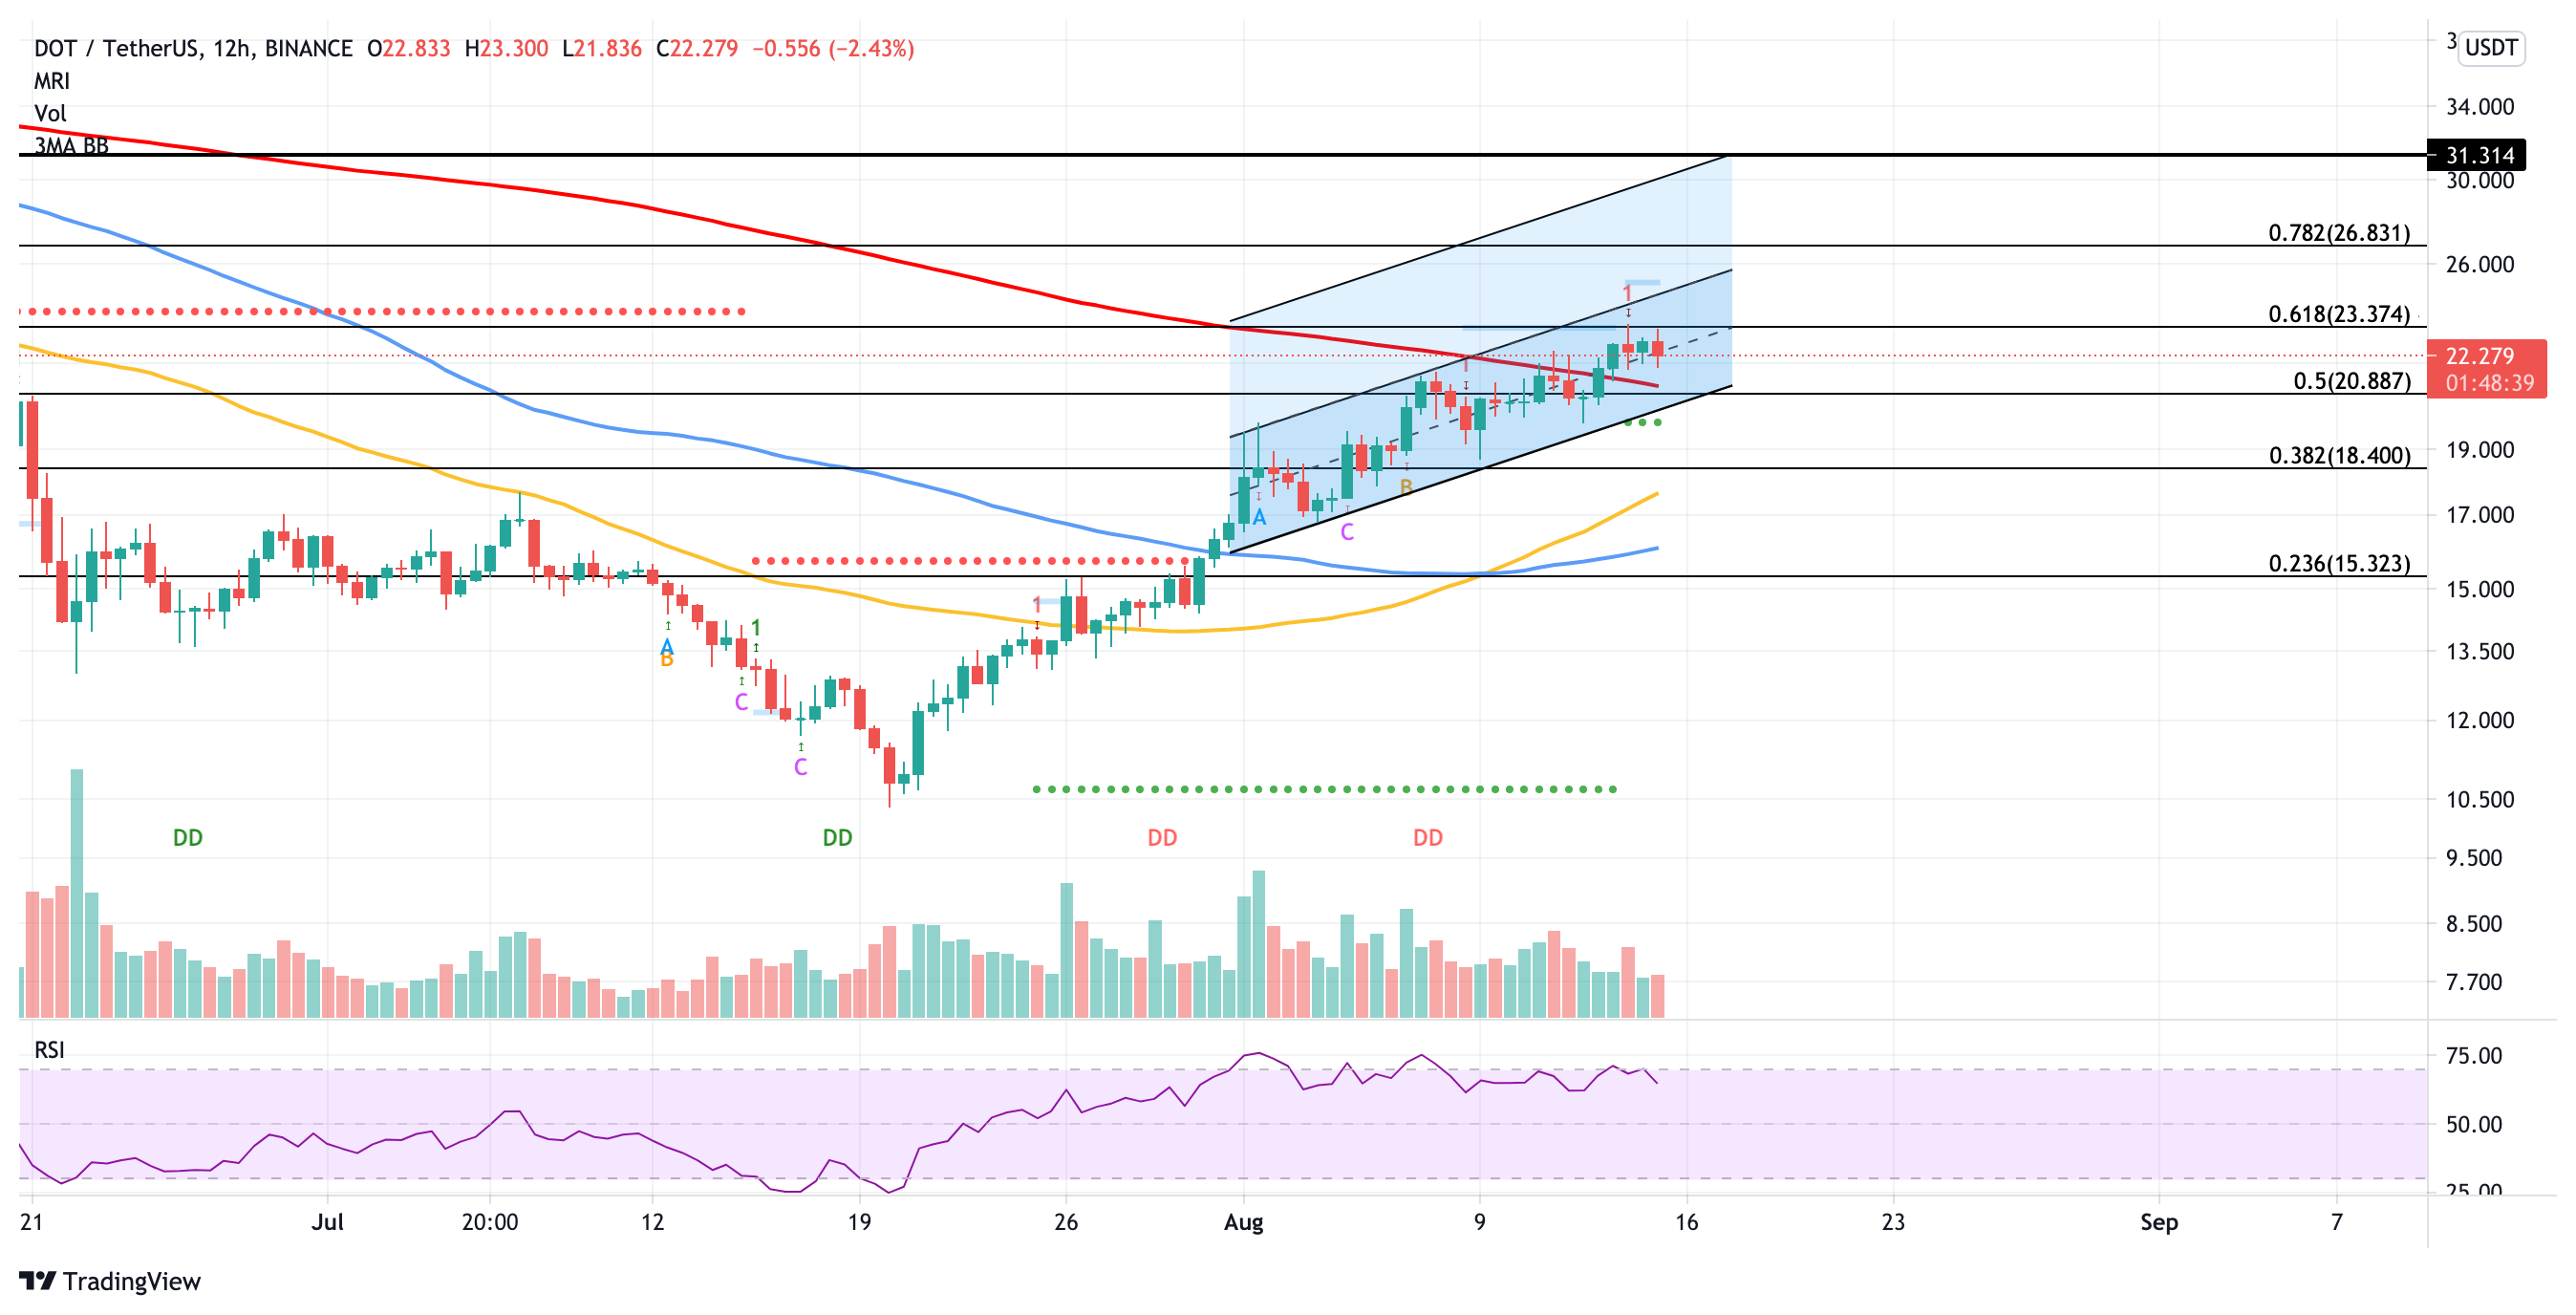
Polkadot price has formed an ascending parallel channel on the 12-hour chart, as DOT has consecutively recorded higher peaks and higher troughs.
The governing technical pattern suggests that the altcoin is headed for a move higher, with a measured target of a 21% surge from the upper boundary of the parallel channel at $31.31, the May 20 high.
Currently, the first obstacle for Polkadot price is the 61.8% Fibonacci extension level at $23.37, then the topside trend line of the prevailing chart pattern at $25.10, coinciding with the breakout line given by the Momentum Reversal Indicator (MRI).
The last hurdle prior to reaching the bullish target is at the 78.2% Fibonacci extension level at $26.83. Investors should note that only a spike in buying pressure would confirm accelerating interest, incentivizing Polkadot price to achieve the bullish forecast.
DOT/USDT 12-hour chart
Should the buyers fail to lift prices higher against the sellers, DOT may continue to move sideways within the parallel channel until either the bulls or the bears take charge.
The first line of defense for Polkadot price is at the 200 twelve-hour Simple Moving Average (SMA) at $21.07, nearing the 50% Fibonacci extension level. Further selling pressure may see DOT fall further to retest the lower boundary of the parallel channel as support at $20.47.
In the event of Polkadot price slicing below the aforementioned level of support, DOT test the reliability of the support line given by the MRI at $19.88 before dropping further to discover support at the 38.2% Fibonacci extension level at $18.40.
A robust trend reversal may see Polkadot price collapse to reach the 50 and 100 twelve-hour SMAs. However, this reversal of fortune is not expected unless a massive spike in selling pressure materializes.
Information on these pages contains forward-looking statements that involve risks and uncertainties. Markets and instruments profiled on this page are for informational purposes only and should not in any way come across as a recommendation to buy or sell in these assets. You should do your own thorough research before making any investment decisions. FXStreet does not in any way guarantee that this information is free from mistakes, errors, or material misstatements. It also does not guarantee that this information is of a timely nature. Investing in Open Markets involves a great deal of risk, including the loss of all or a portion of your investment, as well as emotional distress. All risks, losses and costs associated with investing, including total loss of principal, are your responsibility. The views and opinions expressed in this article are those of the authors and do not necessarily reflect the official policy or position of FXStreet nor its advertisers.

