OMG Network price is ready for a pullback as technicals scream sell
|- OMG Network price hit an intraday high at $3.83 but failed to hold the ground.
- Despite the retreat, the coin has gained over 6% on a day-to-day basis and over 30% week-to-week.
OMG Network is the 37th largest digital coin with a current market capitalization of $500 billion and an averaged daily trading volume of $353 million. It is most actively traded on Binance and Huobi Global. Several indicators show that OMG is poised for a pullback in the short-term as the digital asset hits a robust resistance level on the way up.
OMG looks poised for a retrace according to various indicators
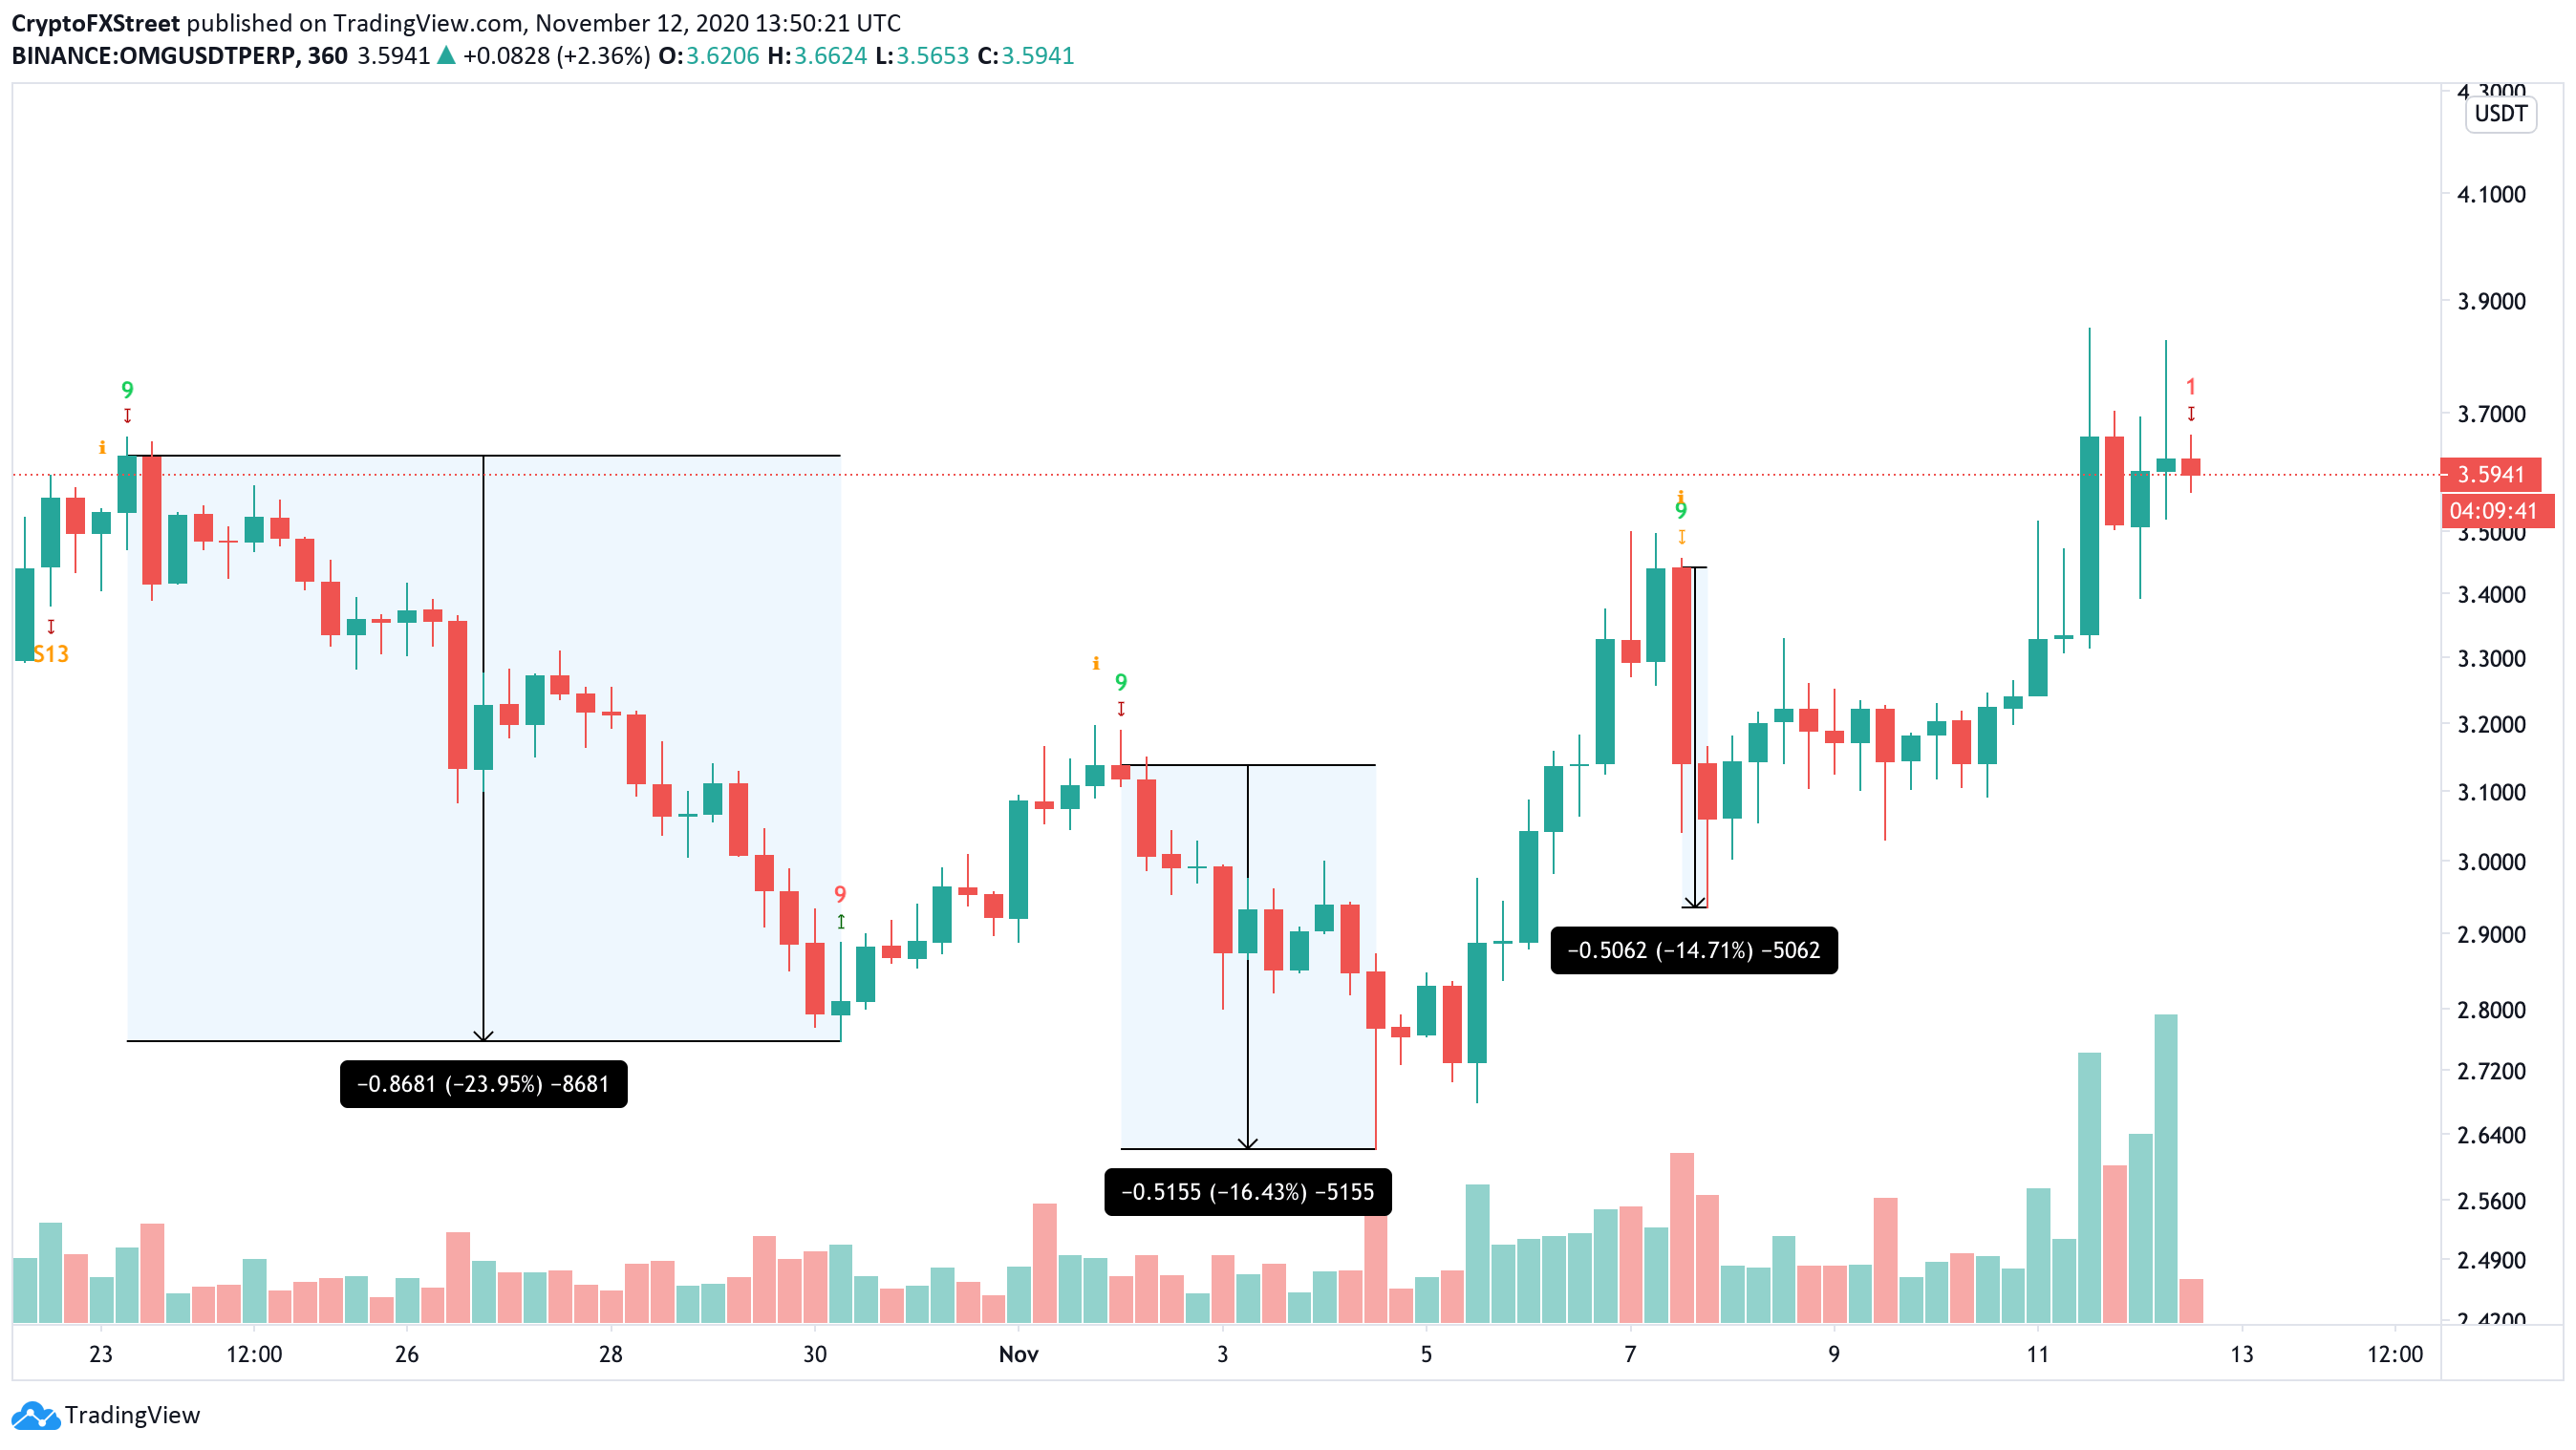
On the 6-hour chart, the TD Sequential indicator has just presented a sell signal. The past three sell signals given by this indicator had significant bearish follow-through, indicating a high chance that the last call will also drive OMG Network price down.
OMG/USD 6-hour chart
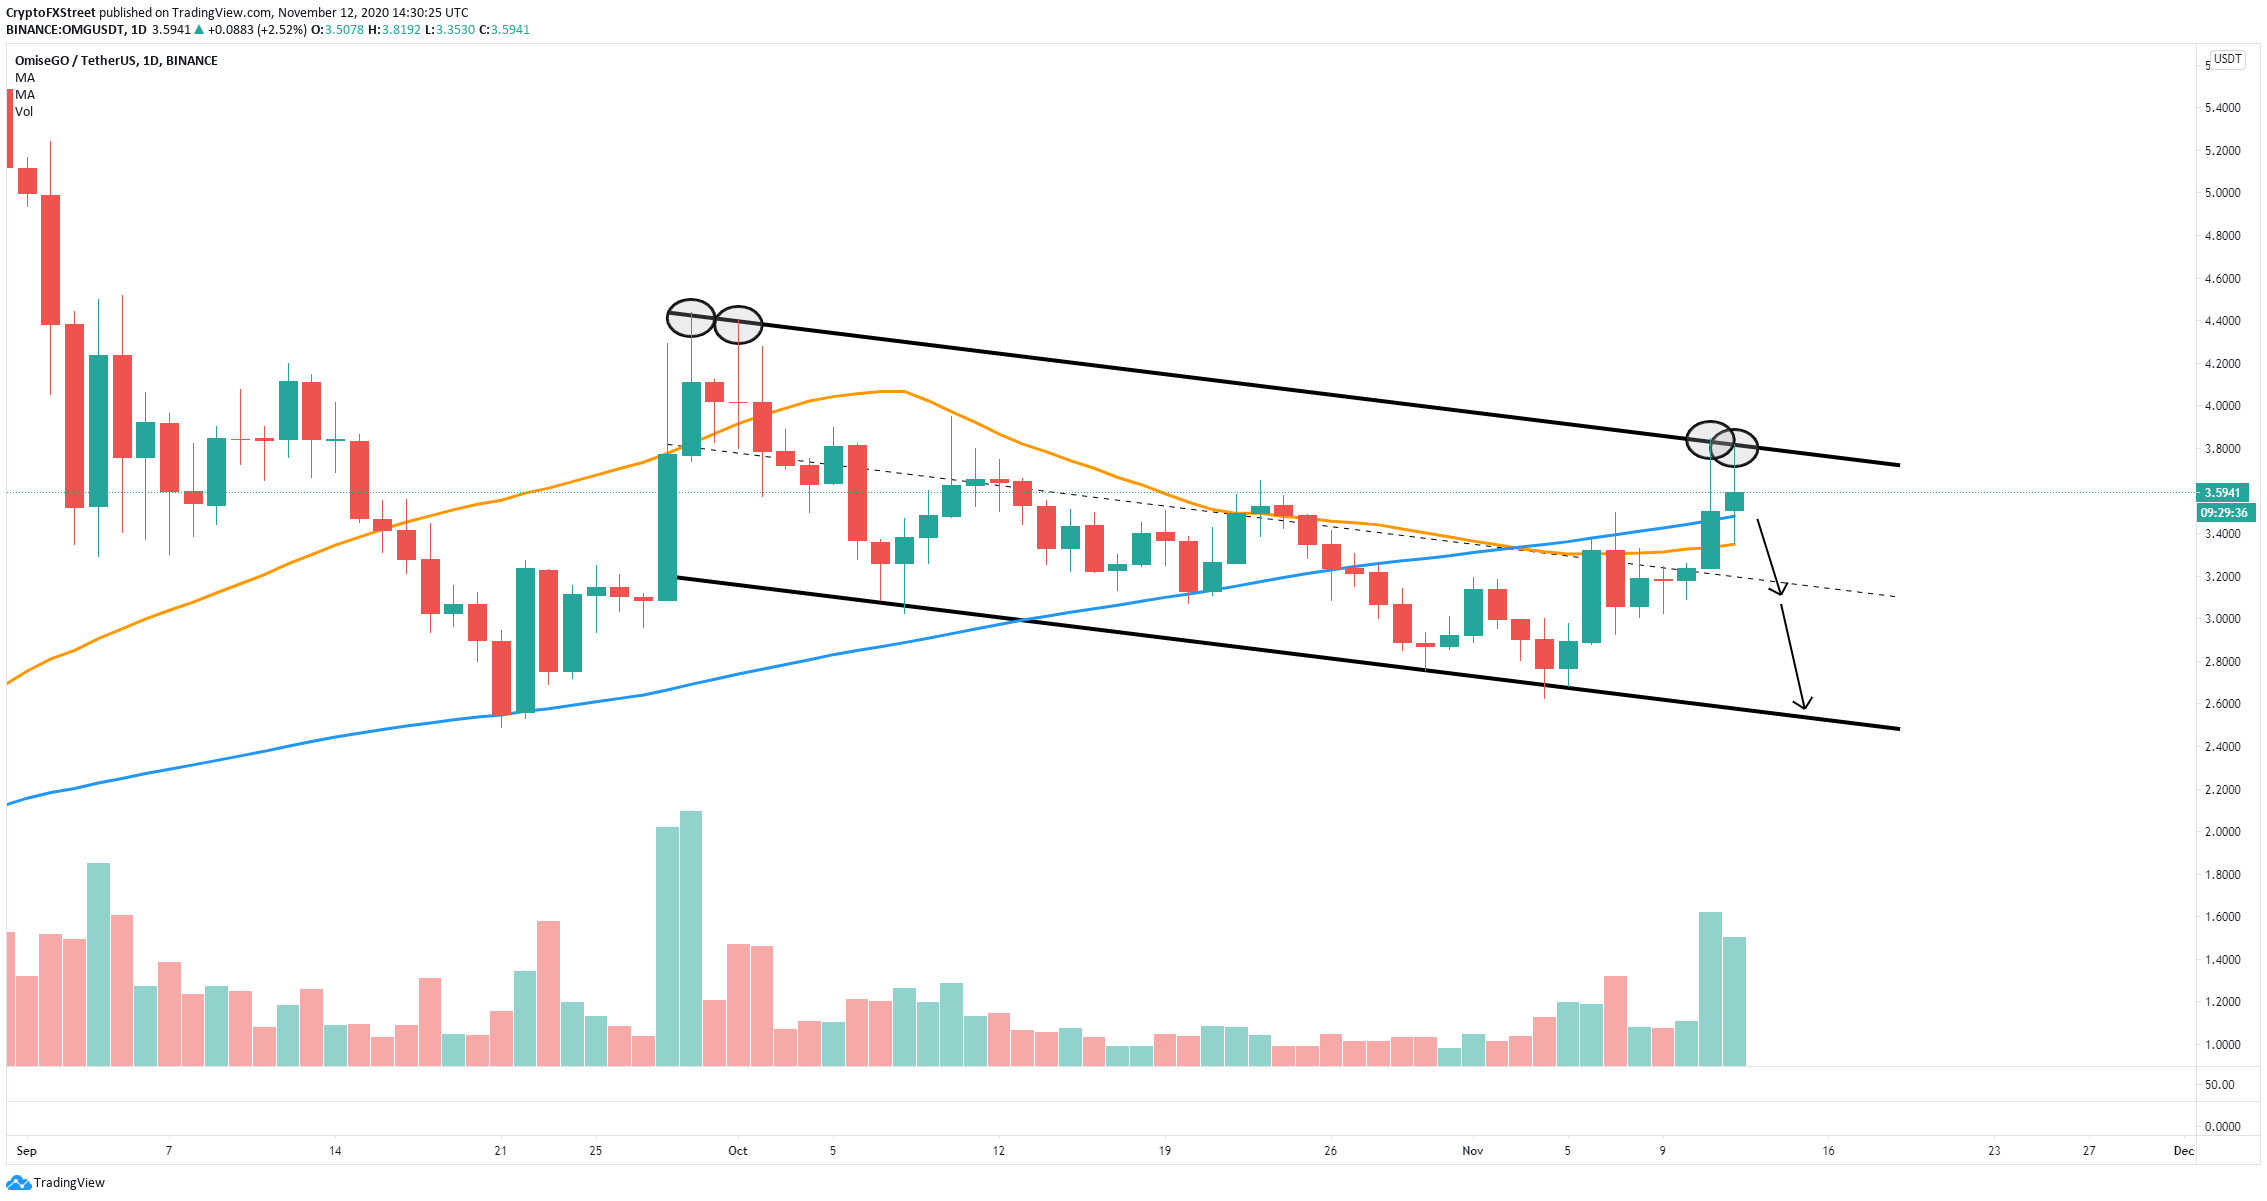
The In/Out of the Money Around Price (IOMAP) chart shows that the next significant support level sits around $3.4. A breakdown from this point could drive OMG Network price to $3.1 according to the IOMAP chart. On the daily chart, OMG seems to have established a descending parallel channel.
OMG/USD daily chart
The upper trendline at $3.8 is acting as a strong resistance level, rejecting the price twice in the past 48 hours. The 100-SMA and 50-SMA coincide around the healthy support level at around $3.4, adding more strength to the theory that a breakdown from this point would lead to a decline in OMG Network price towards $3.1 and as low as $2.6 in the longer-term, the lower boundary of the pattern.
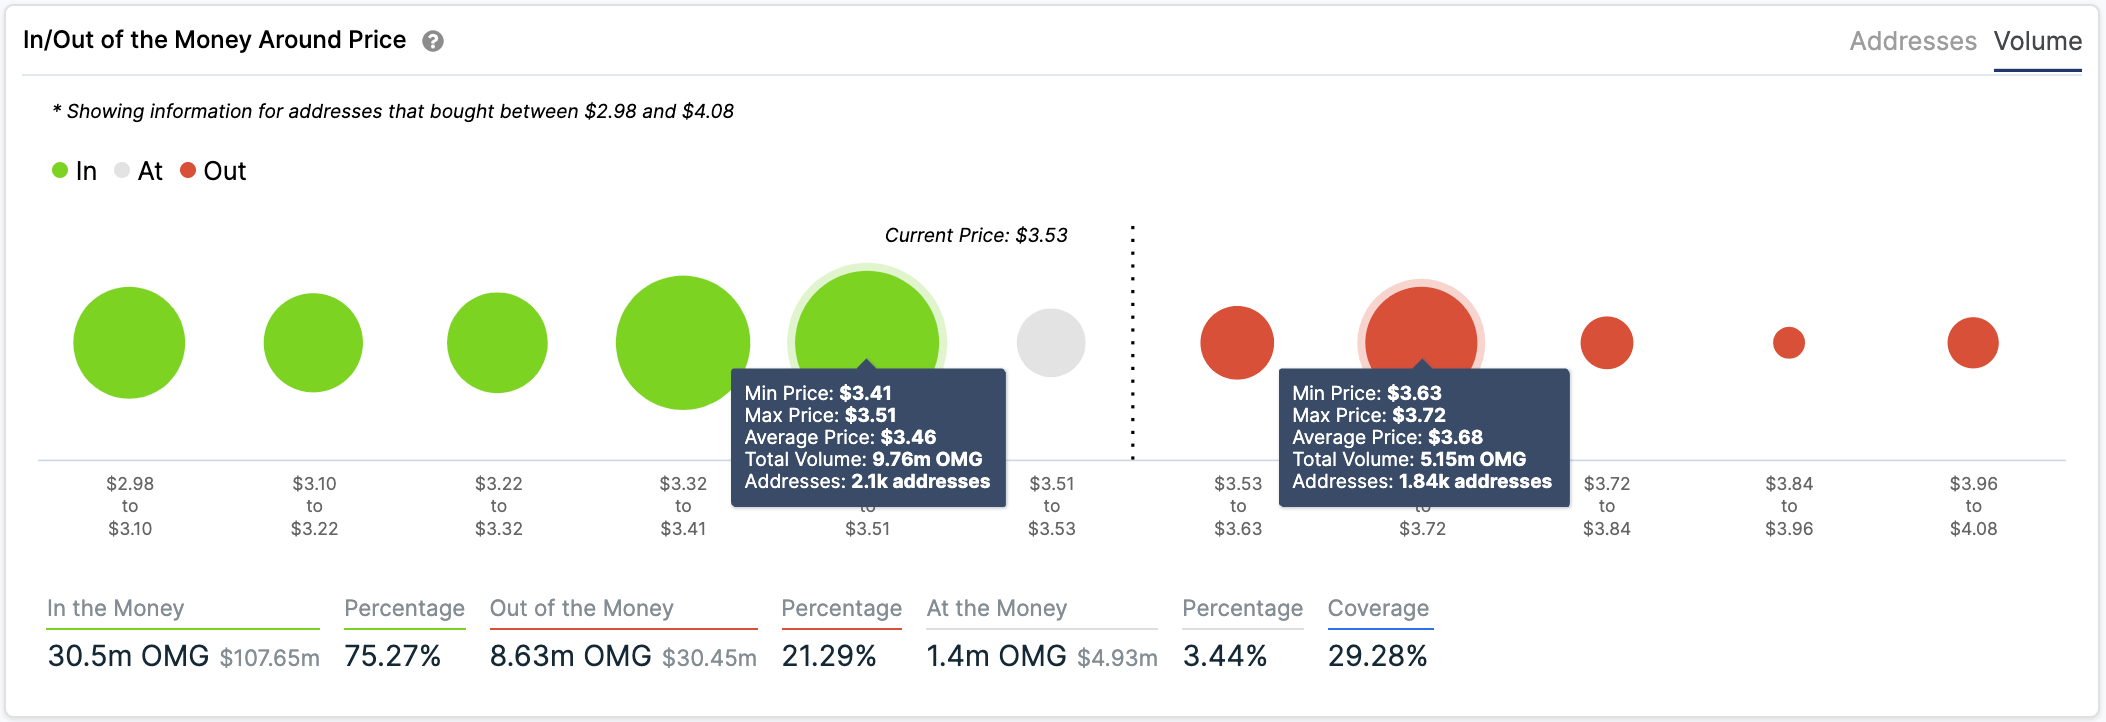
OMG IOMAP chart
However, the same IOMAP chart also shows only one significant resistance area between $3.63 and $3.72. Over 1,750 addresses holding nearly 6 million coins create a local resistance here. It seems that a breakout above this point could quickly drive OMG Network price to $4.
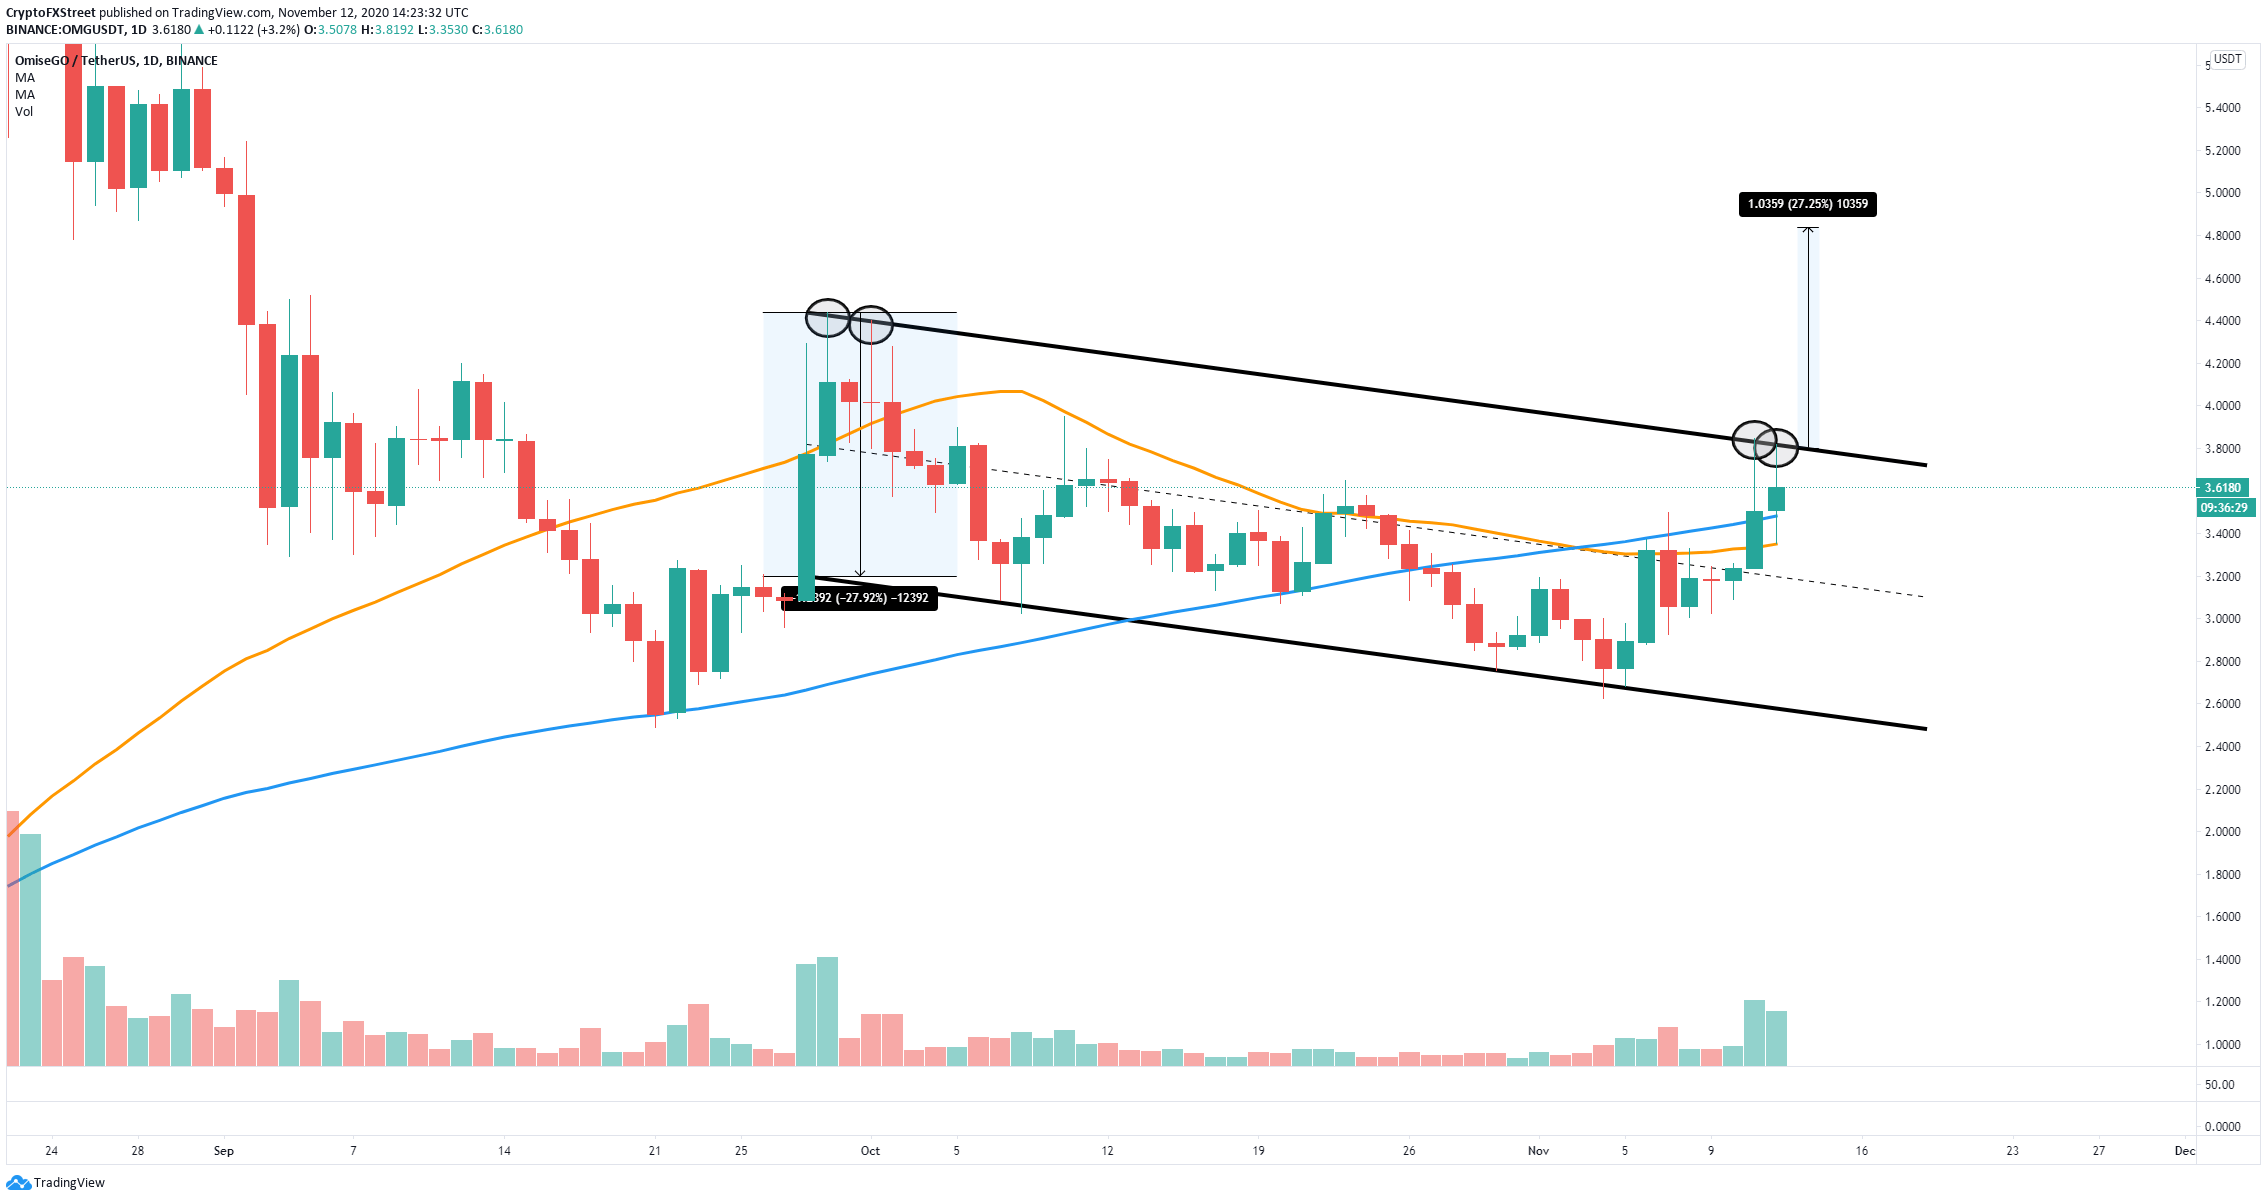
OMG/USD daily chart
A breakout would also mean climbing above the upper trendline of the descending parallel channel on the daily chart, adding more strength to the move, and targeting $4.8 in the long-term using the height of the pattern as a reference point.
Information on these pages contains forward-looking statements that involve risks and uncertainties. Markets and instruments profiled on this page are for informational purposes only and should not in any way come across as a recommendation to buy or sell in these assets. You should do your own thorough research before making any investment decisions. FXStreet does not in any way guarantee that this information is free from mistakes, errors, or material misstatements. It also does not guarantee that this information is of a timely nature. Investing in Open Markets involves a great deal of risk, including the loss of all or a portion of your investment, as well as emotional distress. All risks, losses and costs associated with investing, including total loss of principal, are your responsibility. The views and opinions expressed in this article are those of the authors and do not necessarily reflect the official policy or position of FXStreet nor its advertisers.