Litecoin Price Forecast: LTC lifts off the Launchpad while $250 beckons
|
- Litecoin bulls engage forward gears after settling above the 200 SMA crucial level.
- A break above the 100 SMA and the 50% Fibonacci level to push LTC above $200 and pave the way for gains eyeing $200.
- The IOMAP shows the absence of strong resistance zones, adding credibility to the uptrend.
- A recently formed death-cross pattern may limit the bulls’ influence over the price.
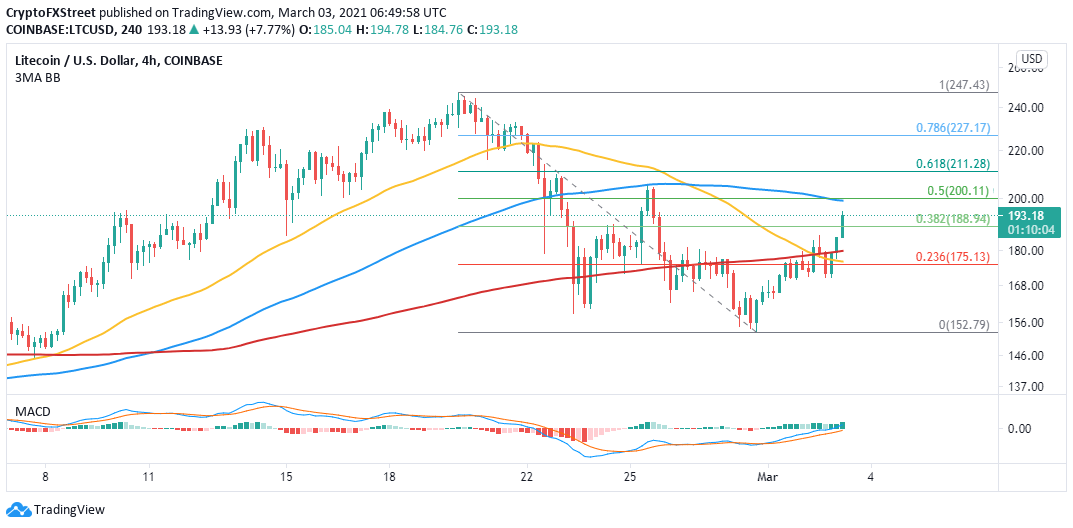
Litecoin has set out north after bouncing from support at $152. Initially, recovery was gradual but became rapid after LTC stepped above the 200 Simple Moving Average on the 4-hour chart. If a near-term confluence level is broken, Litecoin may see massive buy orders triggered in anticipation of an upswing to $250.
Litecoin is setting the bullish pace
The cryptocurrency market is generally quiet, primary because Bitcoin is stuck under $50,000. However, Litecoin seems to be charting a recovery path after stepping above several key levels, including the 23.6% Fibonacci, the 50 SMA, and 200 SMA.
At the time of writing, LTC is trading at $193 amid a persistent push by the bulls to hit price levels above $200. The most significant resistance being the confluence formed by the 200 SMA and the 50% Fibonacci level.
Trading above this seller congestion zone will be particularly bullish because it will serve as confirmation that Litecoin is ready to liftoff to the multi-year high. The Moving Average Convergence Divergence (MACD) is almost crossing into the positive region. If the MACD line (blue) holds above the signal line, the bullish picture will remain intact in the near-term.
LTC/USD 4-hour chart
The IOMAP shows that Litecoin has a relatively smooth path ahead. If the bulls remain persistent with the push to higher levels, a breakout above $200 will be probable. However, the model brings attention to the region running from $218 to $224, whereby roughly 50,000 addresses bought approximately 750,000 LTC. Trading beyond this area would boost Litecoin toward $250.
On the downside, immense support has been established to ensure that Litecoin does not drop significantly from the prevailing price level. For instance, the IOMAP reveals the buyer congestion between $171 and $177. Here, around 83,000 addresses had previously purchased roughly 3.4 million LTC.
Litecoin IOMAP model
Looking at the other side of the picture
The 4-hour chart highlights the formation of a death cross. This pattern is bearish and forms when a longer-term moving average crosses above a short-term moving average. For example, the 200 SMA has recently crossed above the 50 SMA. This scenario shows that selling pressure is hovering and cannot be ignored.
Therefore, Litecoin must hit areas above $200, and perhaps this move will drive it out of the woods and cancel the negative impact of the pattern
Information on these pages contains forward-looking statements that involve risks and uncertainties. Markets and instruments profiled on this page are for informational purposes only and should not in any way come across as a recommendation to buy or sell in these assets. You should do your own thorough research before making any investment decisions. FXStreet does not in any way guarantee that this information is free from mistakes, errors, or material misstatements. It also does not guarantee that this information is of a timely nature. Investing in Open Markets involves a great deal of risk, including the loss of all or a portion of your investment, as well as emotional distress. All risks, losses and costs associated with investing, including total loss of principal, are your responsibility. The views and opinions expressed in this article are those of the authors and do not necessarily reflect the official policy or position of FXStreet nor its advertisers.
