Litecoin Price Forecast: LTC hints at a 15% correction if these key conditions are met
|
- Litecoin price suggests a potential 15% correction after the sweep of the $70.69 range high.
- Depending on the 12-hour RSI’s encounter with the mean level of 50 LTC could either rally or slide lower.
- Invalidation of the bearish outlook will occur on the flip of the $70.69 hurdle into a support floor.
Litecoin (LTC) price shows sigs of exhaustion after its recent upswing. If profit-taking turns into panic selling, then the chances of a steep correction are high for LTC holders.
Read more: Litecoin Price Prediction: LTC to mark new 2023 low as whales’ inactivity hits a three-year high
Litecoin price in a tough position
Litecoin (LTC) price set up a range, extending from $57.69 to $70.69 between August 29 and September 11. Since the formation of this range, LTC has swept the range high and set up a local top at $72.89 on October 24. The subsequent profit-taking has pushed the altcoin back inside the range.
As Litecoin price trades at $67.40, investors can expect a continuation of the pullback. On the 12-hour chart, the Relative Strength Index (RSI) which sits above 50 has a key role to play. A bounce off the mean level could hold the key to making or breaking LTC’s next move.
A failure from bulls could trigger a breakdown of the RSI’s 50 level, which is likely to enforce a bearish outlook. In such a case, Litecoin price could slide lower and aim for the sell-side liquidity resting below the October 19 swing low of $59.70. But in an ideal rangebound scenario, LTC could sweep the range low of $57.69.
This move would constitute a 15% descent and is likely where Litecoin price will consolidate before deciding on its next move.
Read more: Litecoin price is failing recovery as Whales pull back to December 2020 lows
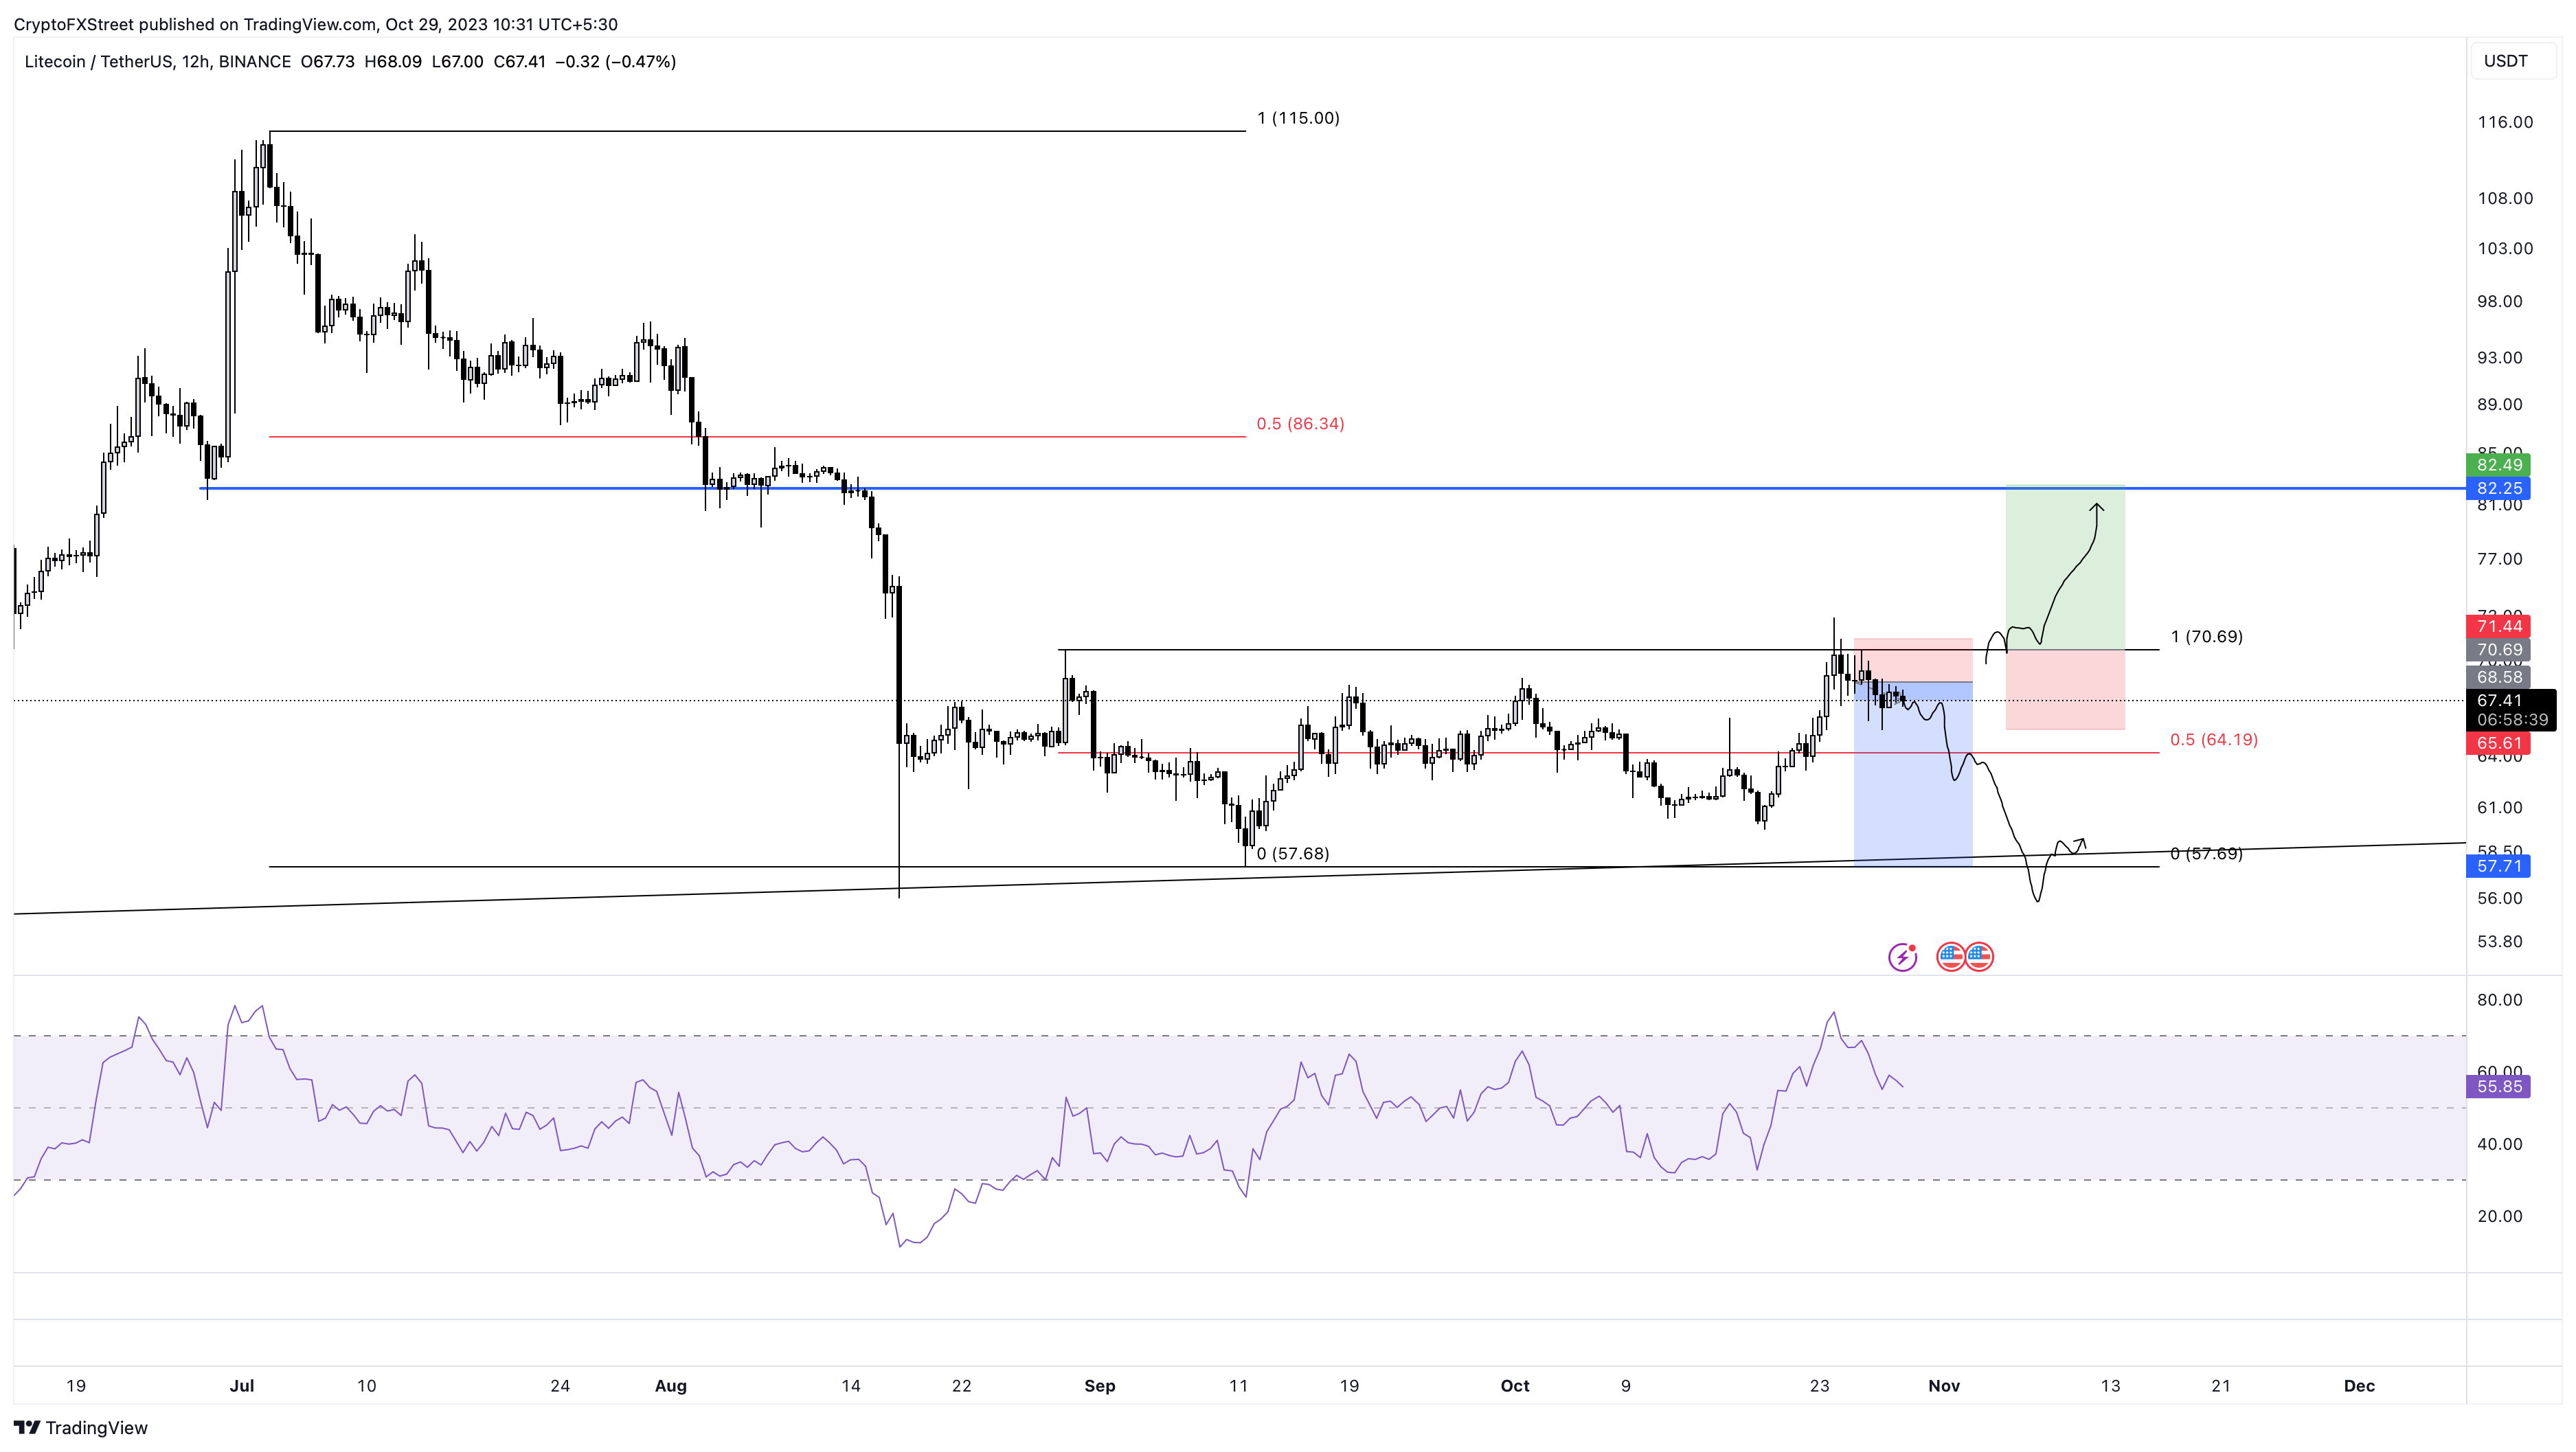
LTC/USDT 12-hour chart
While the rangebound bearish outlook makes logical sense, the correction is dependent on how the 12-hour RSI plays out. If there is a show of strong demand as RSI touches the 50 level, then investors can expect Litecoin price to attempt to flip the range high of $70.69.
A decisive flip of this hurdle into a support floor will invalidate the bearish thesis. In such a case, Litecoin price could revisit the $82.25 hurdle after a 16% upswing.
Information on these pages contains forward-looking statements that involve risks and uncertainties. Markets and instruments profiled on this page are for informational purposes only and should not in any way come across as a recommendation to buy or sell in these assets. You should do your own thorough research before making any investment decisions. FXStreet does not in any way guarantee that this information is free from mistakes, errors, or material misstatements. It also does not guarantee that this information is of a timely nature. Investing in Open Markets involves a great deal of risk, including the loss of all or a portion of your investment, as well as emotional distress. All risks, losses and costs associated with investing, including total loss of principal, are your responsibility. The views and opinions expressed in this article are those of the authors and do not necessarily reflect the official policy or position of FXStreet nor its advertisers.