Internet Computer price poised for a rally after breaking above descending trendline
|
- Internet Computer price broke above a descending trendline on Tuesday, eyeing a rally ahead.
- Coinglass data shows that ICP’s open interest is increasing, indicating new buying is occurring.
- On-chain data paints a bullish picture as ICP’s long-to-short ratio is above one, and trading volume is rising.
- A daily candlestick close below $7.67 would invalidate the bullish thesis.
Internet Computer’s (ICP) price broke above a descending trendline on Tuesday, gaining over 14% daily and signaling a positive move ahead. ICP’s on-chain metrics further support this bullish development, as rising open interest, increasing trading volume, and long-to-short ratio above one hint at an upcoming rally.
ICP price shows potential for a rally
Internet Computer's price broke above a descending trendline (drawn by joining multiple daily close with a trendline from mid-April) on Tuesday. It also broke and closed above its daily resistance level at $7.86 and its 50-day Exponential Moving Average (EMA) at $7.97. At the time of writing, ICP retraces by 4% to trade at $8.57 during the early European session on Wednesday.
If ICP continues to retrace, it could find support around the descending trendline breakout level of around $7.86.If ICP bounces off that level, it could rally over 28% to retest its July 27 high of $10.11.
The Relative Strength Index (RSI) and the Awesome Oscillator (AO) on the daily chart trades above their respective neutral levels of 50 and zero. These momentum indicators strongly indicate bullish dominance.
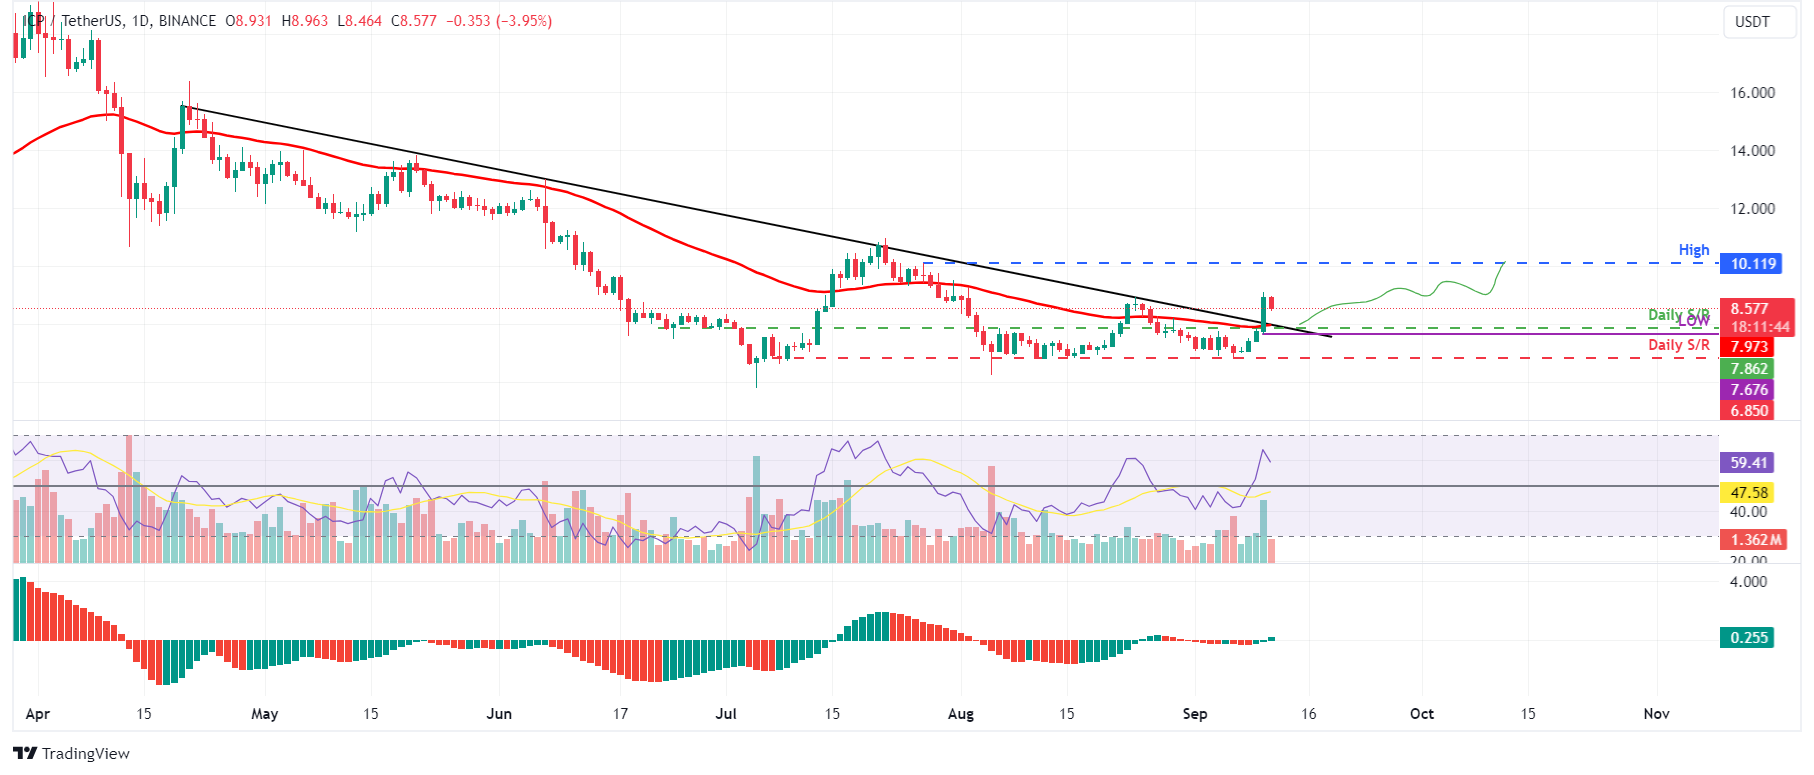
ICP/USDT daily chart
Coinglass’s data shows that the futures’ Open Interest (OI) in ICP at exchanges is also increasing. The OI indicates the total number of outstanding derivative contracts that have not been settled and whether money flows into the contract are increasing or decreasing.
Increasing OI represents new or additional money entering the market and new buying, which generally tends to support prices. When OI decreases, it is usually a sign that the market is liquidating, more investors are leaving, and the selling pressure increases.
The graph below shows that ICP’s OI increased from $35.87 million on Monday to $47.21 million on Wednesday, its highest level since the end of July.
ICP Open Interest chart
Moreover, Coinglass’s Binance ICP’s long-to-short ratio is 1.29, and it has been trading above one since August 27, meaning more traders are betting on the asset’s price to rise.
Binance ICP long-to-short ratio chart
Crypto-aggregator DefiLlama data shows that ICP’s daily trading volume increased from $1.37 million on Saturday to $2.38 million on Wednesday, the highest since June 18. This 73% rise in daily trading volume indicates a surge in traders’ interest and liquidity in the ICP chain.
ICP daily trading volume chart
Despite positive on-chain metrics and bullish price action, if ICP’s daily candlestick closes below the Tuesday’s low of $7.67, the bullish thesis will be invalidated as a lower low will be formed in the daily time frame. This development would give rise to bearish sentiment, leading to a decline of 10.5% to restest its next daily support at $6.85.
Information on these pages contains forward-looking statements that involve risks and uncertainties. Markets and instruments profiled on this page are for informational purposes only and should not in any way come across as a recommendation to buy or sell in these assets. You should do your own thorough research before making any investment decisions. FXStreet does not in any way guarantee that this information is free from mistakes, errors, or material misstatements. It also does not guarantee that this information is of a timely nature. Investing in Open Markets involves a great deal of risk, including the loss of all or a portion of your investment, as well as emotional distress. All risks, losses and costs associated with investing, including total loss of principal, are your responsibility. The views and opinions expressed in this article are those of the authors and do not necessarily reflect the official policy or position of FXStreet nor its advertisers.