Injective price sets for a 32% rally
|- Injective price breaks above the daily resistance level at $23.46, suggesting a bullish move ahead.
- On-chain data suggests that INJ's development activity and Open Interest are rising, signaling positive sentiment among investors.
- Network Realized Profit/Loss metric shows INJ's capitulation event on Tuesday.
- A daily candlestick close below $17.77 would invalidate the bullish thesis.
Injective (INJ) price surpassed the daily resistance level at $23.46 on Tuesday, indicating potential bullish momentum. At the time of writing, INJ is slightly up 1% at $25.94 on Thursday.
On-chain data reveals increasing development activity and rising Open Interest for INJ, reflecting optimistic investor sentiment. Additionally, the Network Realized Profit/Loss metric highlights a capitulation event on Tuesday, further supporting expectations for a bullish trend.
Injective price shows potential for a rally
Injective price broke above the daily resistance level at $23.46 on Tuesday and rallied 3% the next day.
If the daily level at $23.46 holds as pullback support, Injective's price could rally 32% to retest its next daily resistance at $31.12.
The Relative Strength Index (RSI) and Awesome Oscillator (AO) on the daily chart are comfortably above their respective mean levels of 50 and zero, respectively. These momentum indicators strongly indicate bullish dominance.
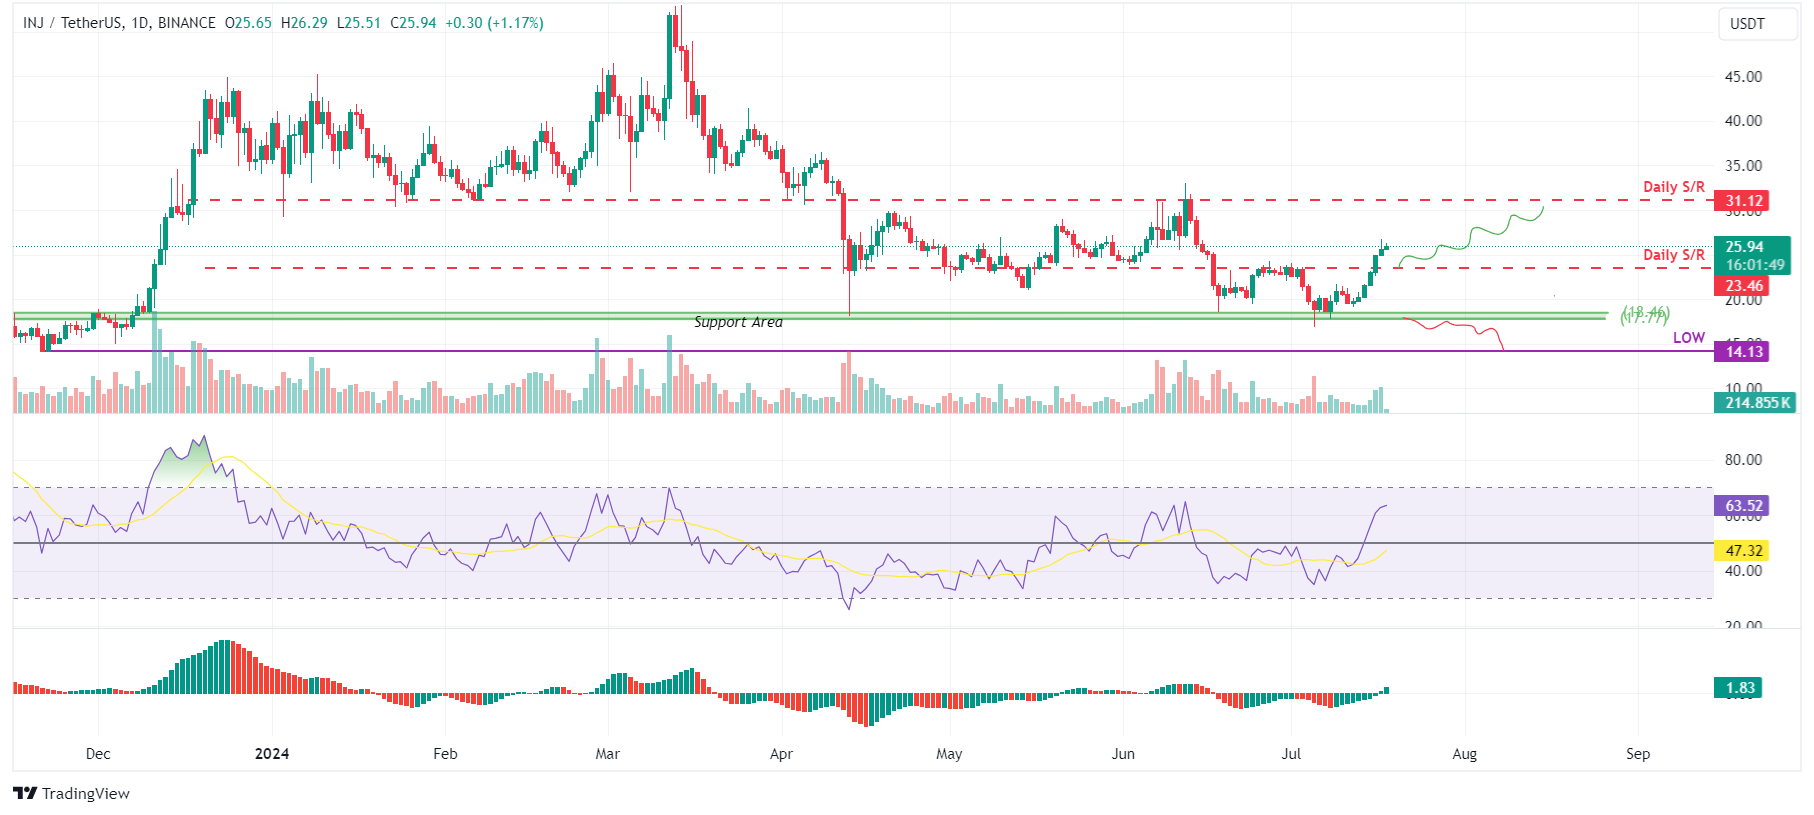
INJ/USDT daily chart
On-chain data provider Santiment's Network Realized Profit/Loss (NPL) indicator computes a daily network-level Return On Investment (ROI) based on the coin's on-chain transaction volume. Simply put, it is used to measure market pain. Strong spikes in a coin's NPL indicate that its holders are, on average, selling their bags at a significant profit. On the other hand, strong dips imply that the coin's holders are, on average, realizing losses, suggesting panic sell-offs and investor capitulation.
In INJ's case, the NPL indicator slumped from 60,133 to -4.71 million on Tuesday. This massive negative downtick indicates that the holders are, on average, realizing losses, suggesting panic sell-offs and investor capitulation.
On the other hand, during this capitulation event, the INJ supply on exchanges, which has been continuing to fall since June 18, decreased by 2%. This development indicates that investors are removing INJ tokens for exchanges to store in their wallets, which reduces the selling activity and further denotes their confidence in Injtective.
INJ Network Realized Profit/Loss (NPL) and Supply of Exchange chart
Data from CoinGlass shows that the future's Open Interest (OI) in INJ at exchanges is increasing. The OI indicates the total number of outstanding derivative contracts that have not been settled (offset by delivery) and whether money flows into the contract are increasing or decreasing.
Increasing OI represents new or additional money coming into the market and new buying happening, which is a bullish trend. When OI decreases, it is usually a sign that the market is liquidating, more investors are leaving, and the current price trend is ending.
As shown in the graph below, INJ's OI increased from $73.59 million on July 14 to $98.97 million on Thursday, indicating that new or additional money is entering the market and new buying is occurring.
INJ Open Interest chart
Additionally, INJ's long-to-short ratio is 1.43. This ratio above one generally reflects bullish sentiment in the market as more traders anticipate the price of the asset to rise, further bolstering INJ's bullish outlook.
INJ Long/Short Ratio chart
Even though the on-chain metric and technical analysis point to a bullish outlook, if Injective's daily candlestick closes below $17.77, the lower boundary of the support area, the bullish thesis would be invalidated by producing a lower low on the daily timeframe. In this case, the Injective price would crash 20% to the previous support level of $14.13.
Information on these pages contains forward-looking statements that involve risks and uncertainties. Markets and instruments profiled on this page are for informational purposes only and should not in any way come across as a recommendation to buy or sell in these assets. You should do your own thorough research before making any investment decisions. FXStreet does not in any way guarantee that this information is free from mistakes, errors, or material misstatements. It also does not guarantee that this information is of a timely nature. Investing in Open Markets involves a great deal of risk, including the loss of all or a portion of your investment, as well as emotional distress. All risks, losses and costs associated with investing, including total loss of principal, are your responsibility. The views and opinions expressed in this article are those of the authors and do not necessarily reflect the official policy or position of FXStreet nor its advertisers.