Injective price primed for a relief rally following retest of support area
|- Injective price approaches its key support area between $17.77 to $18.46.
- Network Realized Profit/Loss metric shows INJ’s capitulation event on June 17.
- On-chain data suggests INJ’s development activity is rising, signaling positive sentiment among investors.
- A daily candlestick close below $17.77 would invalidate the bullish thesis.
Injective price (INJ) approaches its key support area on Tuesday with on-chain data indicating a recent capitulation event for INJ and rising development activity. This fosters positive sentiment among investors poised to drive INJ prices higher.
Injective price sets for a relief rally
Injective price is currently testing its support area, extending between $17.77 and $18.46.
This area has previously acted as a crucial support and resistance area.
If this support holds, the Injective price could rally 36% from $18.46 to its June 17 high of $25.34.
The Relative Strength Index (RSI) and the Awesome Oscillator (AO) have slipped below their mean levels of 50 and zero. If bulls are indeed making a comeback, then both momentum indicators must maintain their positions above their respective mean levels. Such a development would add a tailwind to the recovery rally.
If the bulls are aggressive and the overall crypto market outlook is positive, INJ could even break above $25.34 and extend an additional 22% rally to retest its daily resistance level at $31.12.
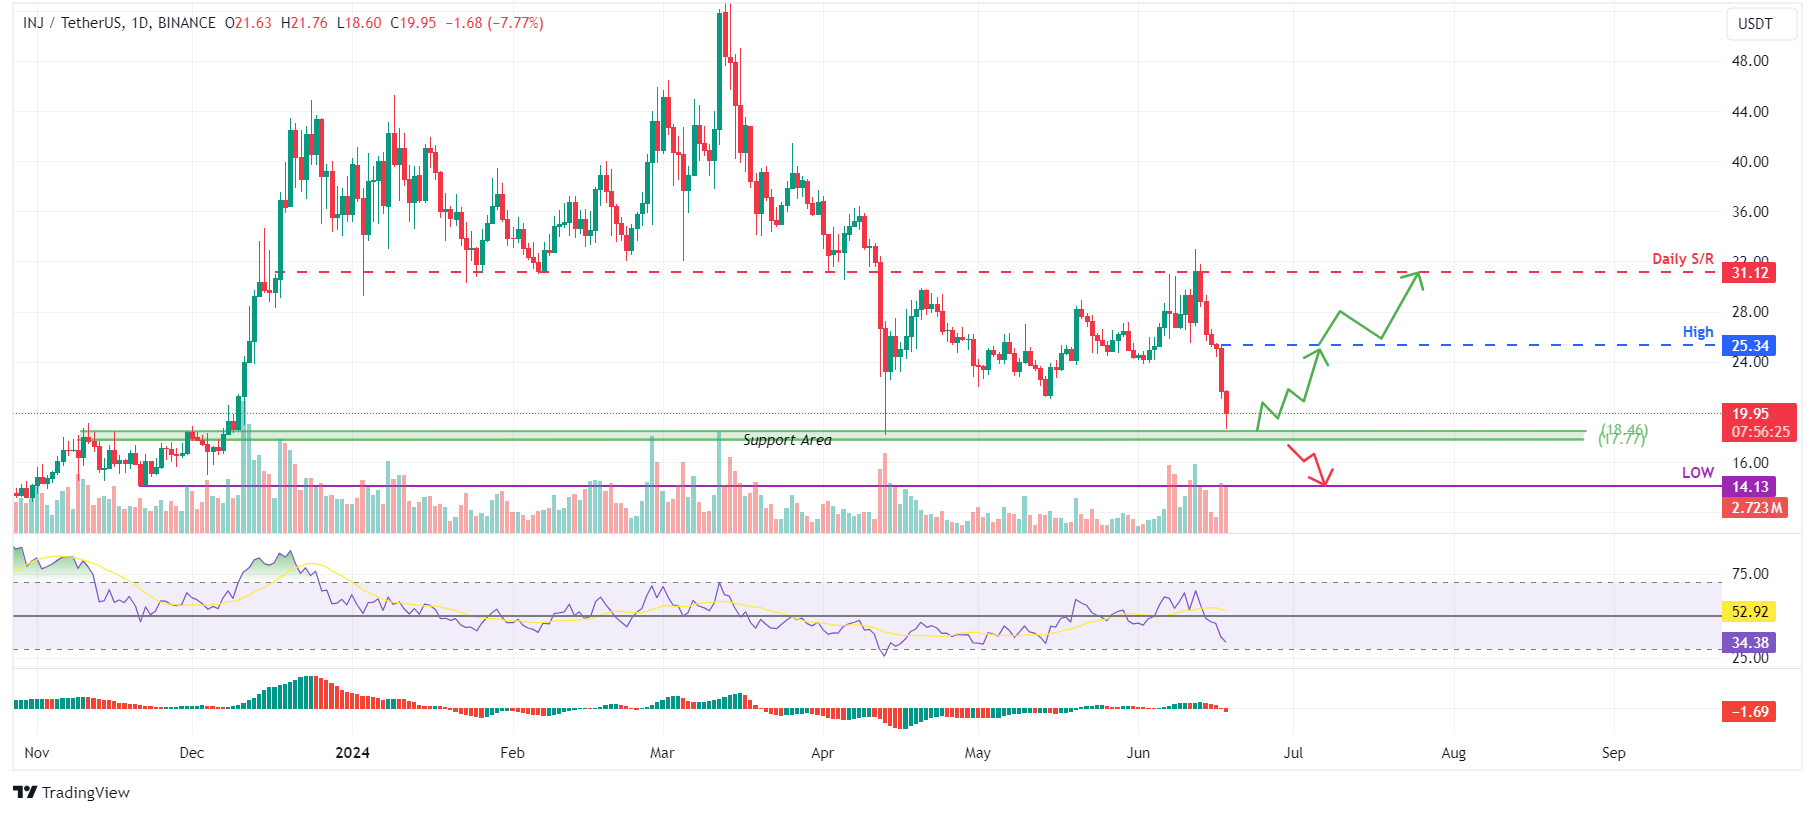
INJ/USDT daily chart
On-chain data provider Santiment’s Network Realized Profit/Loss (NPL) indicator computes a daily network-level Return On Investment (ROI) based on the coin’s on-chain transaction volume. Simply put, it is used to measure market pain. Strong spikes in a coin’s NPL indicate that its holders are, on average, selling their bags at a significant profit. On the other hand, strong dips imply that the coin’s holders are, on average, realizing losses, suggesting panic sell-offs and investor capitulation.
In INJ’s case, the NPL indicator slumped from -105,050 to -2.91 million in one day, coinciding with a 13.7% price crash. This massive negative downtick indicates that the holders are, on average, realizing losses, suggesting panic sell-offs and investor capitulation.
During this capitulation event, the INJ supply on exchanges rose 50% in one day. This is a bearish development, which further denotes investor confidence in INJ.
INJ Network Realized Profit/Loss chart
Santiment’s Development Activity metric tracks the frequency of project development events recorded in the public GitHub repository over time. A rise in this metric usually suggests continuous endeavors to uphold, innovate, and improve the protocol, which is generally seen as favorable by investors and stakeholders. Conversely, a decline in this metric might raise apprehensions about the project's endurance, capacity for innovation, and engagement with the community in the foreseeable future.
As in INJ’s case, the index rose 5% in the last ten days and to the highest level in the past three months. The rise in INJ’s Developing Activity adds further credence to the bearish outlook.
INJ Development Activity chart
However, if INJ's daily candlestick closes below $17.77 and establishes a lower low on the daily timeframe, it may signal a shift in market dynamics that favors bearish sentiment. Such a change could nullify the bullish outlook, leading to a 20% crash in the Injective price to the previous support level of $14.13.
Information on these pages contains forward-looking statements that involve risks and uncertainties. Markets and instruments profiled on this page are for informational purposes only and should not in any way come across as a recommendation to buy or sell in these assets. You should do your own thorough research before making any investment decisions. FXStreet does not in any way guarantee that this information is free from mistakes, errors, or material misstatements. It also does not guarantee that this information is of a timely nature. Investing in Open Markets involves a great deal of risk, including the loss of all or a portion of your investment, as well as emotional distress. All risks, losses and costs associated with investing, including total loss of principal, are your responsibility. The views and opinions expressed in this article are those of the authors and do not necessarily reflect the official policy or position of FXStreet nor its advertisers.