Ethereum price readies for another reversal ahead of the much-awaited FOMC meeting
|
- Ethereum price continues to encounter resistance, slightly under $1,700.
- If support at $1,450 wavers, ETH will likely tumble to the 50 SMA at $1,300.
- According to Rekt Capital, Ether shows the ability to make a significant move towards the end of July.
Ethereum price is doddering marginally below $1,550 following a few days of stability. The leading smart contracts token had jumped from support roughly at $1,040 in the previous week, and nearly brushed shoulders with $1,700. ETH’s ability to carry on with the recovery to $2,000 may be limited due to the upcoming Federal Open Market Committee (FOMC) meeting.
How will ethereum price react to the FOMC Meeting
Ethereum price remained steady from early last week, with weekly gains surpassing 15% based on the live price data by CoinGecko, despite the larger cryptocurrency market showing sluggishness. Ether’s resilience was tested further after the news that Tesla sold 75% of its Bitcoin reserves.
Market participants have mixed feelings regarding the FOMC meeting on Wednesday. Interest rates have been rising since the beginning of the year and the committee is expected to continue raising them, throughout the year, with investors anticipating a 75 basis point jump at the next meeting.
Global markets, including stocks and crypto, have been suffering amid mounting pressure on the Fed to control inflation. An immediate reaction to a hike in interest rates could see Ethereum price push past the rock-solid barrier at $1,700, but the impact of the change tends to kick in several weeks later as investors make adjustments. In other words, a reflex bullish move could be a bull trap; hence it would be imperative to proceed with caution.
What’s next for Ether?
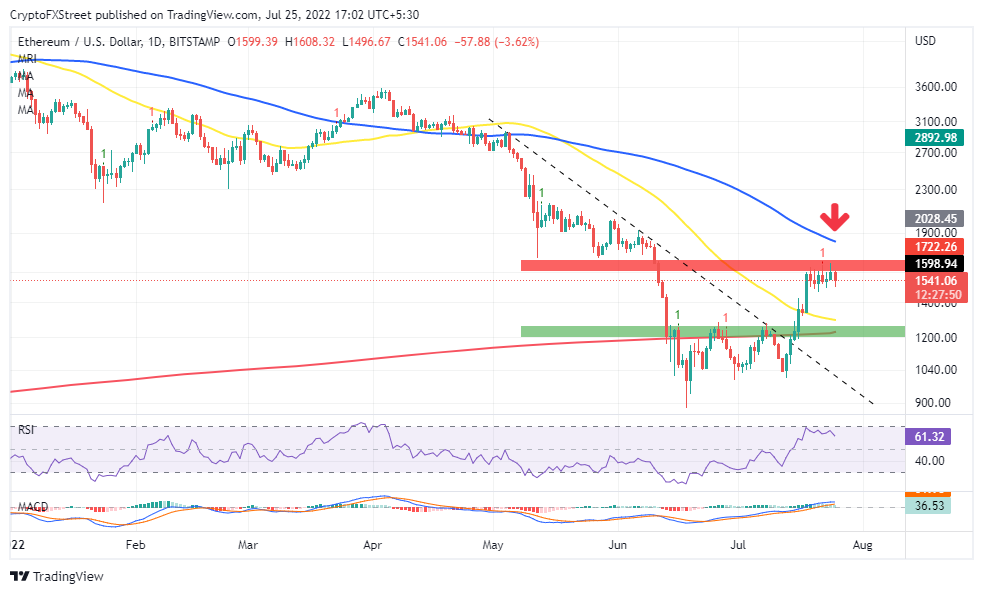
The daily chart highlights increasing selling pressure from the seller congestion at $1,700. Note that with the Relative Strength Index (RSI) already rejected from the overbought region, the path of least resistance will likely remain downward. A daily close beneath the buyer concentration zone around $1,450 could see Ethereum price explore more downhill levels at $1,300, at the 50-day Simple Moving Average (SMA) support. Other crucial levels include $1,200, reinforced by the 100 SMA and significant support at $1,040.

ETH/USD Daily Chart
Contrary to the above analysis, Rekt Capital, a renowned technical analyst, believes that Ethereum price will close the week on a bullish note. However, to do so, ETH will have to flip the resistance we highlighted at $1,700 into support.
$ETH has scope to perform a decent Monthly Close this July
— Rekt Capital (@rektcapital) July 25, 2022
Throughout 2018-2021, orange figured as resistance but ETH enjoyed a strong uptrend once flipped into support#ETH has another chance to flip orange into support upon successful 1M Close above orange#Crypto #Ethereum pic.twitter.com/DL9OcFFJsU
The Moving Average Convergence Divergence (MACD) in the same timeframe suggests that buyers still have the upper hand. As long as the 12-day Exponential Moving Average (SMA) holds above the 26-day EMA, the odds will keep supporting a positive outcome for the second-largest crypto.
Information on these pages contains forward-looking statements that involve risks and uncertainties. Markets and instruments profiled on this page are for informational purposes only and should not in any way come across as a recommendation to buy or sell in these assets. You should do your own thorough research before making any investment decisions. FXStreet does not in any way guarantee that this information is free from mistakes, errors, or material misstatements. It also does not guarantee that this information is of a timely nature. Investing in Open Markets involves a great deal of risk, including the loss of all or a portion of your investment, as well as emotional distress. All risks, losses and costs associated with investing, including total loss of principal, are your responsibility. The views and opinions expressed in this article are those of the authors and do not necessarily reflect the official policy or position of FXStreet nor its advertisers.