Ethereum price has one barrier to break before $1,500
|
- Ethereum price completes a bullish swing trade in ASIA PAC trading.
- ETH price could go higher if the job report in the US disappoints and brings a weaker dollar.
- Expect to see a pop higher to $1,500 before it finds a ceiling at a technical cap.
Ethereum (ETH) price has completed a swing trade to the upside that was mentioned in Wednesday’s top three price predictions article here on FX Street. This raises an interesting point: when trading, it is best to pick a few cryptocurrencies and follow everything involved with their price action instead of trying to trade every cryptocurrency as it catches news for better or for worse. Ethereum price is now at a crossroads with US job numbers this afternoon dictating whether it goes up or down.
ETH price at a crossroad
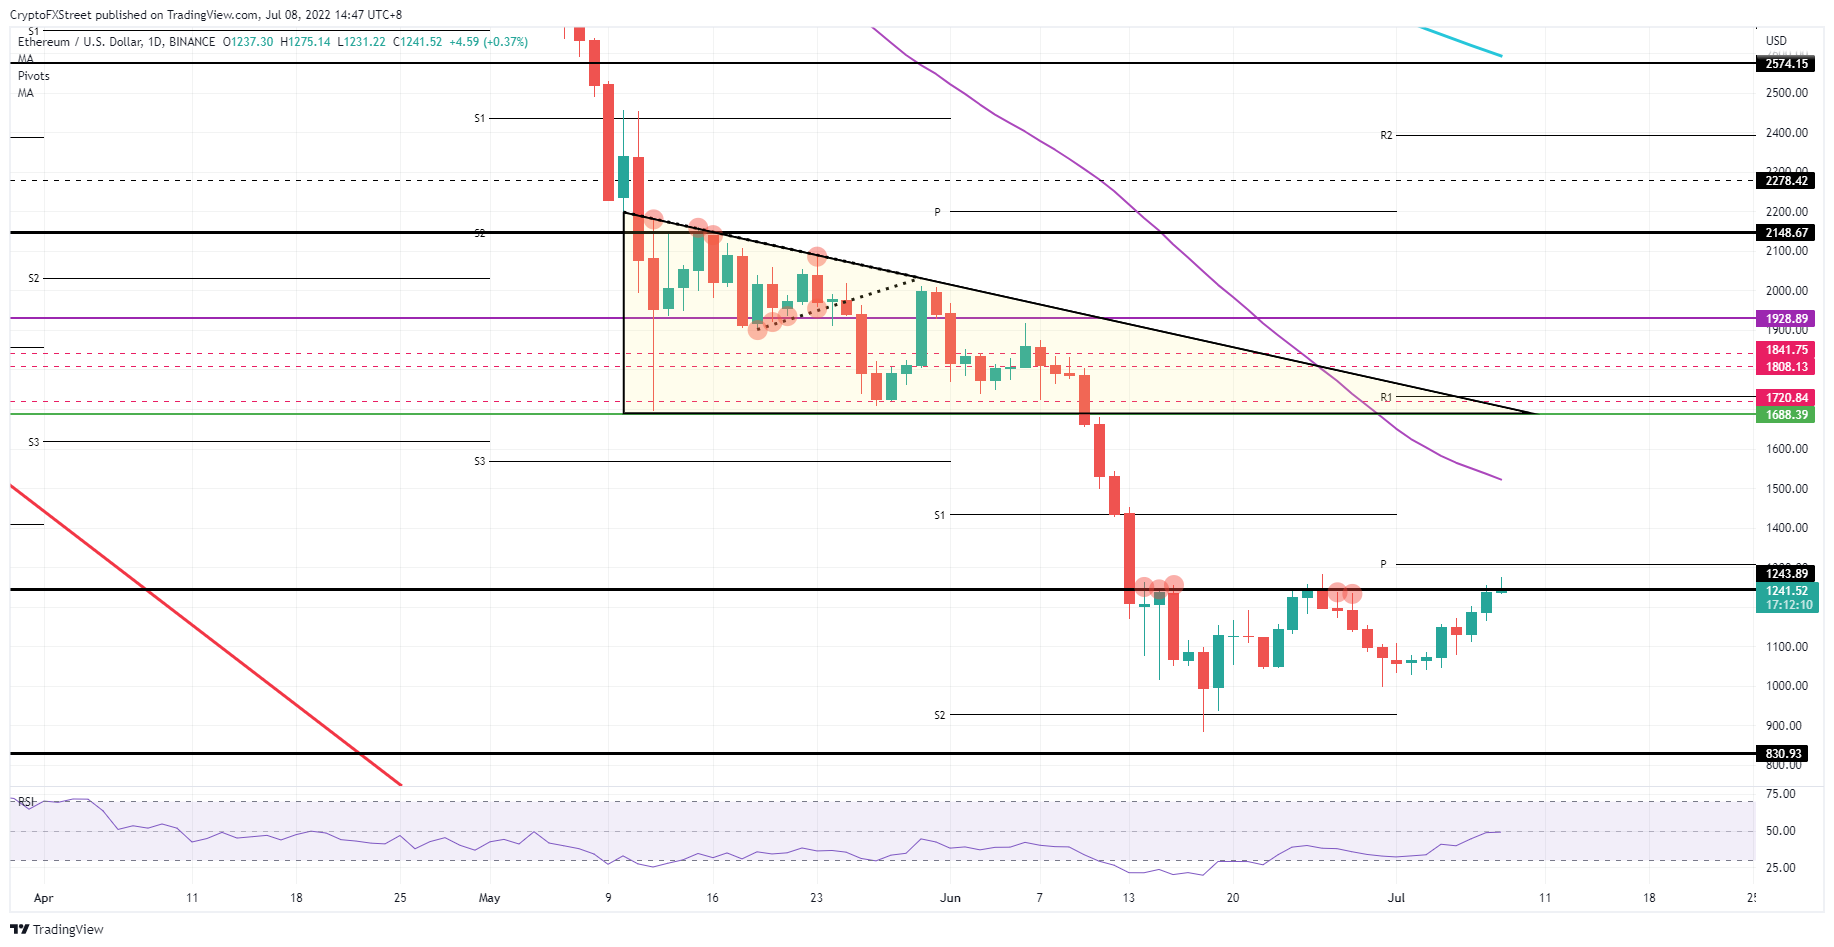
Ethereum price is on the verge of taking the last step to tying up gains for June, depending on whether the swing trade it has just performed still has more room to go. ETH price has hit $1,243 this morning and even broke above it. The risk is that Ethereum price falls, in a repetition of what was seen on June 26, with a false break and full retrace back to $1,000. The Relative Strength Index (RSI) is right on 50, in the middle of its range and could go either way, with slight bias toward favouring bulls.
ETH price could use the US job report this afternoon as a catalyst to jump higher. In both cases, Ethereum price has reasons to rise, whether the result be good or bad. In case of a miss, the dollar will back off and open up a window of dollar weakness where Ethereum can fill the gap by trading higher. And in the case where the job number remains strong, expect to see a lift in sentiment as fears of a US recession recede, and investors are emboldened to start picking up cryptocurrencies again, as household income is expected to remain elevated while inflation and consumer prices drop. In such a scenario, Ethereum could very well hit $1,500 and the level of the 55-day Simple Moving Average (SMA).
ETH/USD daily chart
The risk to the downside is that we see a repetition of what happened on June 26, with ETH price collapsing under a fade triggered by profit-taking at $1,243. Price action is set to drop back towards $1,000 as the swing trade turns into a range trade, with price action being stuck for a couple of weeks. It will be important to monitor the close at the end of this evening after the US closing bell to see if the range holds or gets broken to the upside.
Information on these pages contains forward-looking statements that involve risks and uncertainties. Markets and instruments profiled on this page are for informational purposes only and should not in any way come across as a recommendation to buy or sell in these assets. You should do your own thorough research before making any investment decisions. FXStreet does not in any way guarantee that this information is free from mistakes, errors, or material misstatements. It also does not guarantee that this information is of a timely nature. Investing in Open Markets involves a great deal of risk, including the loss of all or a portion of your investment, as well as emotional distress. All risks, losses and costs associated with investing, including total loss of principal, are your responsibility. The views and opinions expressed in this article are those of the authors and do not necessarily reflect the official policy or position of FXStreet nor its advertisers.

