Ethereum price builds the momentum to hit new all-time highs
|
- Ethereum price develops an entry condition before a test of $5,000.
- The outperformance of Bitcoin is likely to be sustained.
- Downside risks remain but are limited.
Ethereum price is up more than 16% for the week, reflecting a resurgence of buying pressure despite the last three weeks of uncertainty. Point and Figure Analysis indicates a bullish entry opportunity is present.
Ethereum price action prepares for another run at $5,000
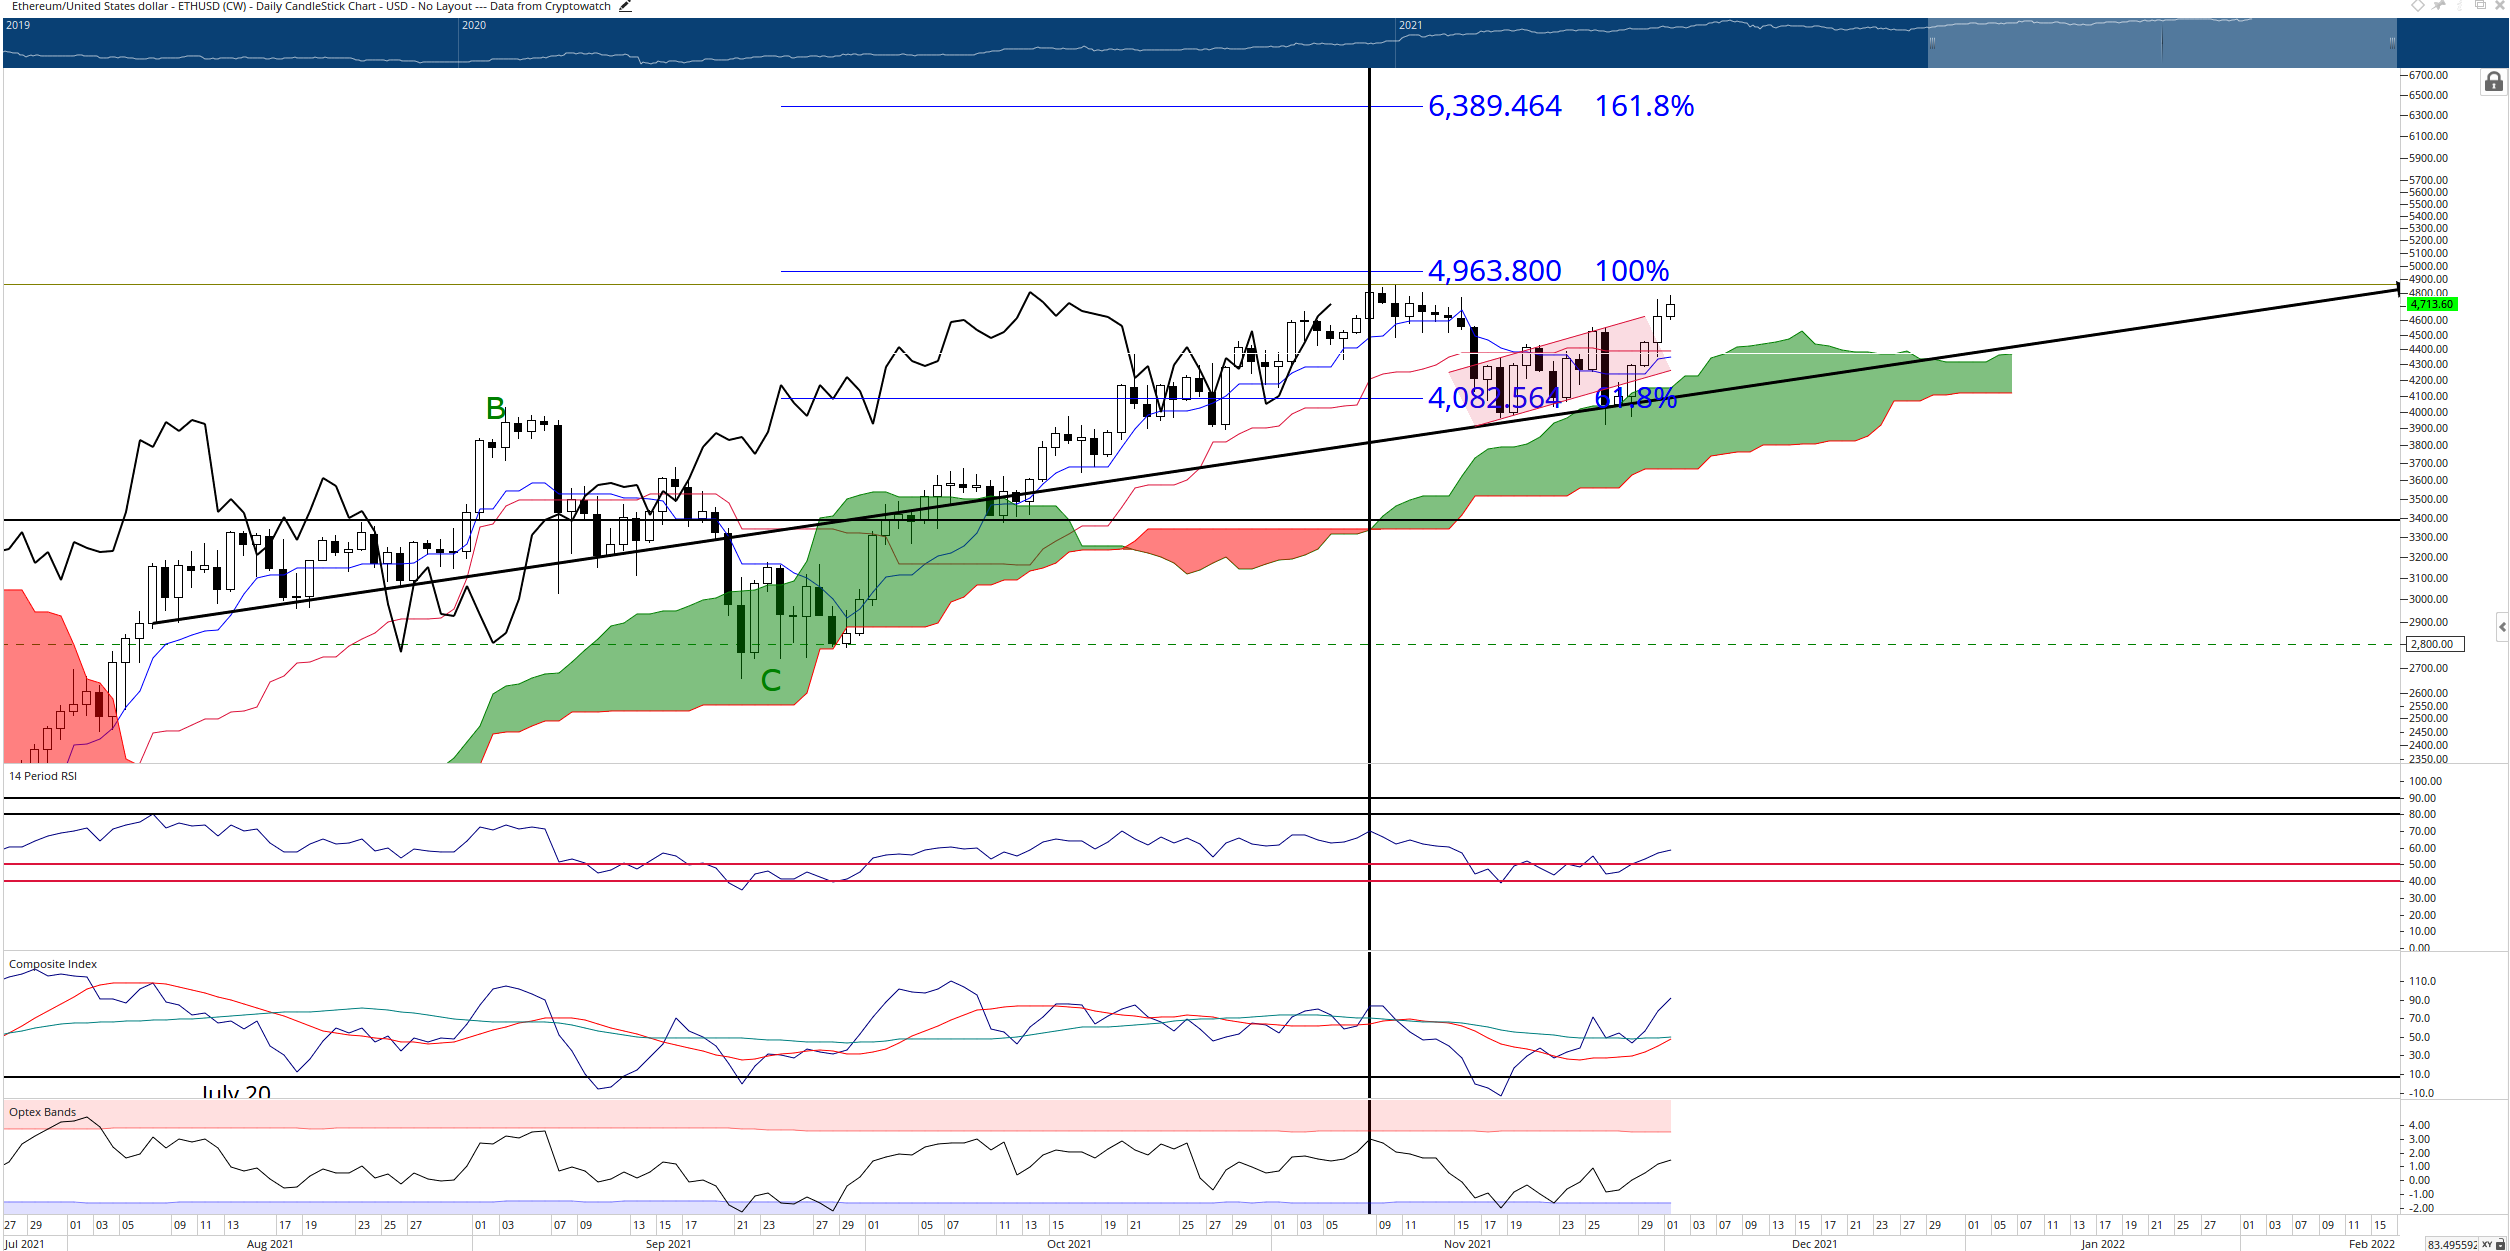
Ethereum price is positioned to be the primary leader in the cryptocurrency space again. It has broken out above the upper trendline of the bear flag it was trading in, denying any short sellers an opportunity to continue further selling pressure. The $4,800 price level is the final resistance zone that bulls must cross to put Ethereum at new all-time highs.
A double-top at $4,800 currently exists on the $50/3-box reversal Point and Figure chart. That double-top top creates what is likely the final buying opportunity before Ethereum hits its new all-time high. Therefore, the hypothetical long setup is a buy stop order at $4,850, a stop loss at $4,600 and a profit target at $6,250. The projected profit target is derived from the Vertical Profit Target Method in Point and Figure Analysis.
Conservative traders may wish to wait for a pullback from the current double-top and then look for a triple-top to develop. Additionally, conservative traders could wait for a Bear Trap, Bearish Fakeout, or Bearish Shakeout pattern before going long.
ETH/USDT Daily Ichimoku Chart
However, downside risks remain. Ethereum could very quickly develop a deep retracement towards the $3,300 level despite a breakout above the former bear flag. Hidden bearish divergence is now present on the daily Ichimoku chart, warning traders that the current upswing may be a false move. A daily close that returns Ethereum inside the bear flag would likely trigger a move south and invalidate any bullish entry opportunities on the Point and Figure chart.
Information on these pages contains forward-looking statements that involve risks and uncertainties. Markets and instruments profiled on this page are for informational purposes only and should not in any way come across as a recommendation to buy or sell in these assets. You should do your own thorough research before making any investment decisions. FXStreet does not in any way guarantee that this information is free from mistakes, errors, or material misstatements. It also does not guarantee that this information is of a timely nature. Investing in Open Markets involves a great deal of risk, including the loss of all or a portion of your investment, as well as emotional distress. All risks, losses and costs associated with investing, including total loss of principal, are your responsibility. The views and opinions expressed in this article are those of the authors and do not necessarily reflect the official policy or position of FXStreet nor its advertisers.

