Ethereum Price Analysis: Looking into the ETH/USD and ETH/BTC daily charts as bearish correction begins
|
- ETH/USD had flown up from $152.85 to $172.58 this Thursday.
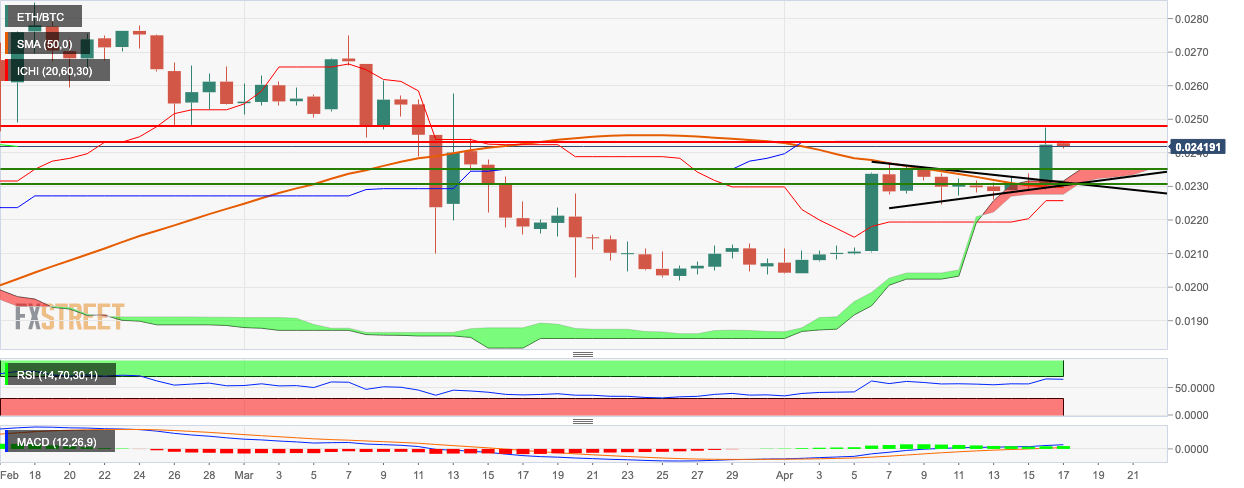
- ETH/BTC lost momentum at the 0.0243 resistance level.
ETH/USD daily chart
ETH/USD faced a bearish start to the day following an overtly bullish Thursday. The price has gone down slightly from $172.58 to $171.69 and is currently facing resistance at the downward trending line and the SMA 200 curve. This Thursday, ETH/USD broke past the SMA 50 during its ascent from $152.85 to $172.58. The Elliott Oscillator has had two green sessions following two straight red sessions.
ETH/BTC daily chart
ETH/BTC bounced off the red Ichimoku cloud and went up from 0.023 to 0.0243 this Thursday, breaking above the pennant structure, in the process. This breakout was an early indicator of the crypto market’s overall bullish movement this Thursday. Currently, tt looks like the bulls have run out of steam near the 0.0243 level as ETH/BTC has dropped a bit to 0.0242. The RSI indicator is trending horizontally around 67.27, next to the overbought zone.
Key levels
Information on these pages contains forward-looking statements that involve risks and uncertainties. Markets and instruments profiled on this page are for informational purposes only and should not in any way come across as a recommendation to buy or sell in these assets. You should do your own thorough research before making any investment decisions. FXStreet does not in any way guarantee that this information is free from mistakes, errors, or material misstatements. It also does not guarantee that this information is of a timely nature. Investing in Open Markets involves a great deal of risk, including the loss of all or a portion of your investment, as well as emotional distress. All risks, losses and costs associated with investing, including total loss of principal, are your responsibility. The views and opinions expressed in this article are those of the authors and do not necessarily reflect the official policy or position of FXStreet nor its advertisers.
-637226948169148401.png)
