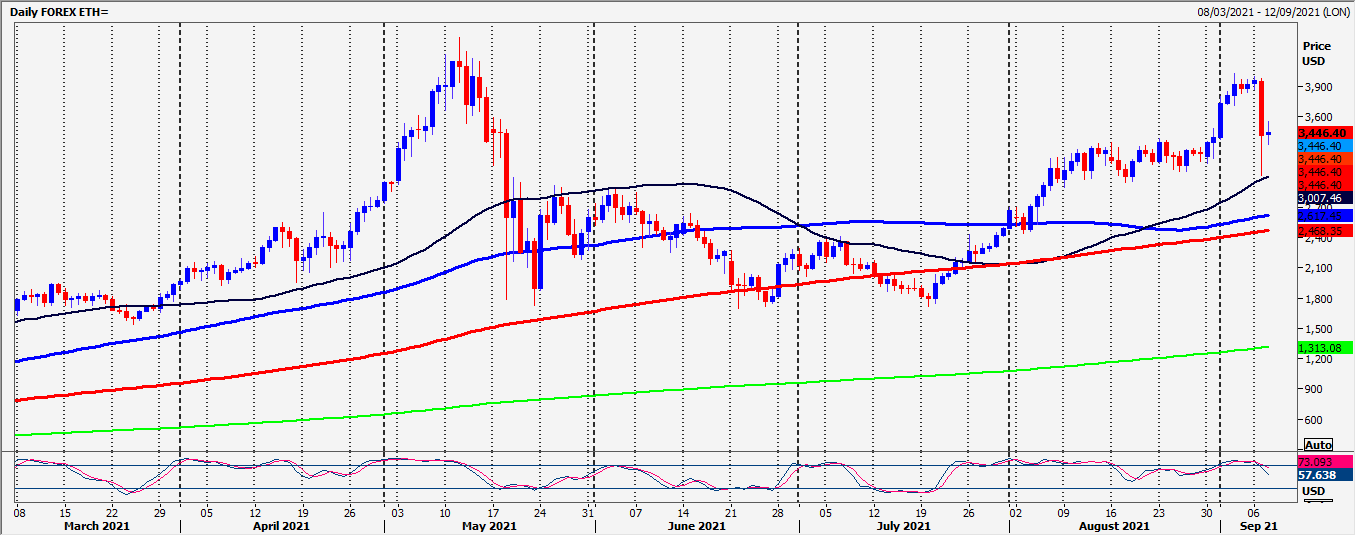
Ethereum first resistance at 3480/3500
|
Bitcoin unexpectedly crashed back below support at 50500/50000 & our buying opportunity at 46400/46000.
A surprise 10000 pip crashed (20%) leaves a dramatic bull trap, with longs from the last 20 days potential facing losses.
Ripple unexpectedly crashed back to 2 week lows wiping out 40% of the 6 week gains.
Ethereum unexpectedly crashed back to 4 week lows wiping out 40% of the 6 week gains.
Daily analysis
Bitcoin massive bearish engulfing candle on the daily & weekly chart signal further potential losses. A classic bull trap. Holding below 47500/47000 targets 46000. Holding below the 200 day moving average at 46000 today is more negative targeting 45300/100, perhaps as far as 44300/44000. Further losses retest yesterday’s low at 43000/42900 but I would not gamble on this holding again today. A break lower targets only minor support at 41500/100. A break below 40000 is the next sell signal.
Holding above the 200 day moving average at 46000 gives some short term hope to bulls but there are likely to be a lot of longs in shock looking for an exit to minimise losses. First resistance at 47200/400. We should struggle to beat this level but further gains meet resistance at 49000/500.
Ripple also has an important bearish engulfing candle (although less severe than Bitcoin). Longs from the last week potential facing losses. Holding below 11170/11340 risks a retest of yesterday’s low at 10550/10250. There is a good chance this will not hold today. Further losses target 9700/9650. If we continue lower look for 9050/30, perhaps as far as strong support at 8600/8550.
Bulls need prices above 11750 but expect strong resistance at 12000/12100 & again at 12550/12650.
Ethereum first resistance at 3480/3500. Holding here tests first support at 3410/00. Below 3350/20 signals further losses to 3270/50, perhaps as far as second support at 3150/3050. A break below 3000 should be a sell signal initially targeting 2890/50. Expect strong support at 2650/2600 but longs need stops below 2500.
Chart
Information on these pages contains forward-looking statements that involve risks and uncertainties. Markets and instruments profiled on this page are for informational purposes only and should not in any way come across as a recommendation to buy or sell in these assets. You should do your own thorough research before making any investment decisions. FXStreet does not in any way guarantee that this information is free from mistakes, errors, or material misstatements. It also does not guarantee that this information is of a timely nature. Investing in Open Markets involves a great deal of risk, including the loss of all or a portion of your investment, as well as emotional distress. All risks, losses and costs associated with investing, including total loss of principal, are your responsibility. The views and opinions expressed in this article are those of the authors and do not necessarily reflect the official policy or position of FXStreet nor its advertisers.
