Ethereum Classic Price Prediction: ETC quietly positions for a rally to $100
|
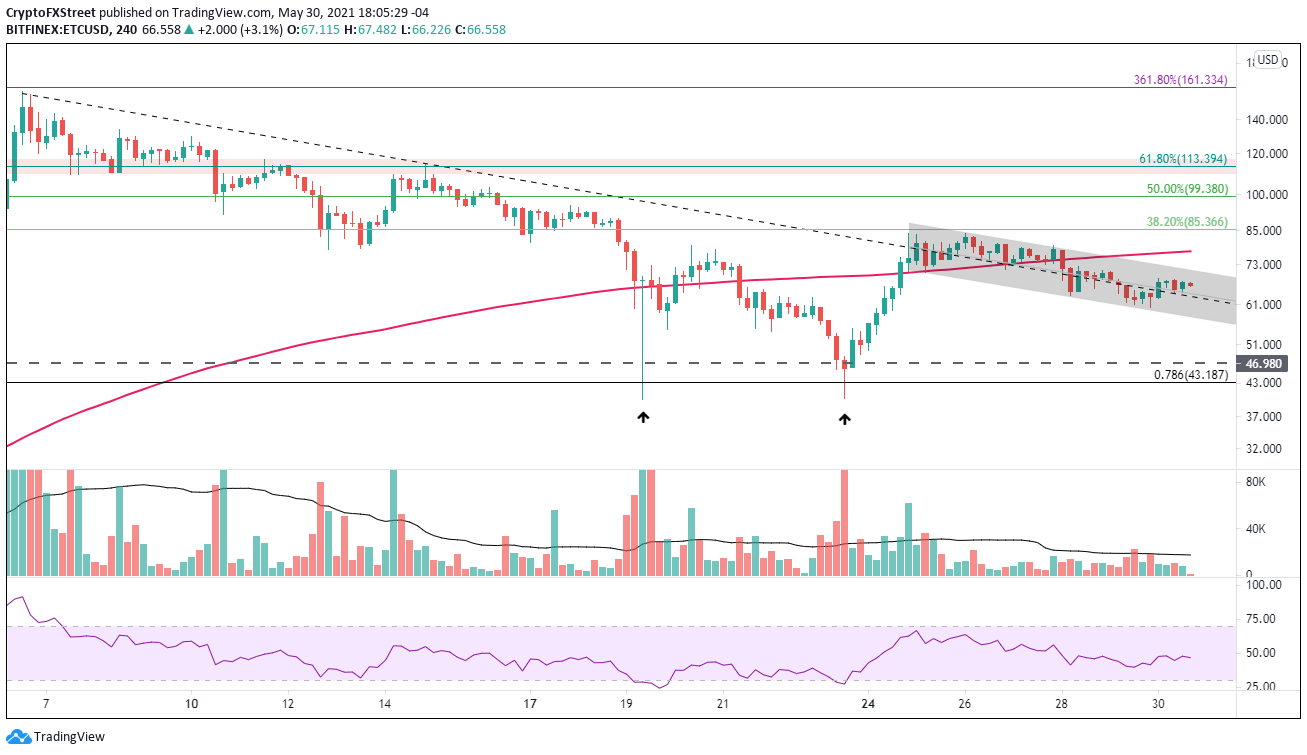
- Ethereum Classic price locked in a channel along May’s declining trend line on the intra-day charts.
- ETC 50-day simple moving average (SMA) containing the drift lower over the last two days.
- Daily and weekly Relative Strength Indexes (RSI) no longer showing overbought readings.
Ethereum Classic price closed last week with a 45% decline, but it responded earlier this week with a 65% rally from the May 23 close, lifting the digital asset beyond May’s declining trend line. The ETC rebound did not introduce an overbought reading on any pertinent timeframe, projecting that the slow drift lower from the May 26 high is not the initial stage of a new leg lower. Instead, it is a quiet release of the compression provoked by the series of sharp declines and rebounds the preceding days.
Ethereum Classic price weighed down by broader crypto volatility and uncertainty
Ethereum Classic price made a statement on May 24, closing up 42.33%, the largest daily gain since May 2017. The historic recovery put bears on notice and paved the way for ETC to overcome the resistance introduced by May’s declining trend line.
No doubt, the ETC developments until May 23 were an extraordinary reversal of fortune for investors. On May 19, Ethereum Classic price collapsed 55% in a matter of hours and had erased 75% of ETC value from the all-time high on May 6 of $158.76. The deep correction followed a 1200% advance over the previous six weeks after breaking out from a symmetrical triangle at the beginning of April. Nevertheless, Ethereum Classic price is still on pace to close May with an 80% gain.
A positive outcome of the steep correction was removing the overbought readings on the daily and weekly Relative Strength Indexes. It has positioned Ethereum Classic price to overpower future resistance and, as a result, revive the larger rally into new highs.
A close above the upper trend line of the descending channel at $71.50 would spark a renewal of investor commitment, boosting Ethereum Classic price to the 200 four-hour SMA at $77.54. Once the intra-day moving average is discarded, ETC will locate notable resistance at the junction of the May 26 high at $84.08 with the 38.2% Fibonacci retracement of the May decline at $85.36.
If Ethereum Classic price surmounts the $85.00 level, it will be unleashed to test the 50% retracement at $99.38 and the psychologically important $100.00, representing a 50% rally for the cheaper Ethereum.
Other resistance points are the 61.8% retracement at $113.94, the all-time high at $158.76 and finally, the 361.8% extension of the 2018-2019 correction at $161.33, offering a 140% gain for committed ETC investors.
ETC/USD 4-hour chart
The bullish vision for Ethereum Classic price will be undermined by a close below the channel’s lower trend line at $57.90. Further selling pressure will not collide with meaningful support until the 2018 high at $46.98. It would proclaim that ETC is building a more complex bottom, or the cryptocurrency is embarking a new leg lower, beyond the May 19 and May 23 lows.
The price action of ETH ultimately sways Ethereum Classic price. Based on the mixed outlook for Ethereum, it is fair to say that the aspirations for ETC to liberate from the descending channel may need a bit more patience.
Information on these pages contains forward-looking statements that involve risks and uncertainties. Markets and instruments profiled on this page are for informational purposes only and should not in any way come across as a recommendation to buy or sell in these assets. You should do your own thorough research before making any investment decisions. FXStreet does not in any way guarantee that this information is free from mistakes, errors, or material misstatements. It also does not guarantee that this information is of a timely nature. Investing in Open Markets involves a great deal of risk, including the loss of all or a portion of your investment, as well as emotional distress. All risks, losses and costs associated with investing, including total loss of principal, are your responsibility. The views and opinions expressed in this article are those of the authors and do not necessarily reflect the official policy or position of FXStreet nor its advertisers.
