Ethereum Classic Price Analysis: 161.8% Fib extension close to 7.67 could be the next target
|- ETC/USD trades over 6% higher on the session as it outperforms the rest of its major peers.
- The price looks set to hit the previous wave high on the daily chart.
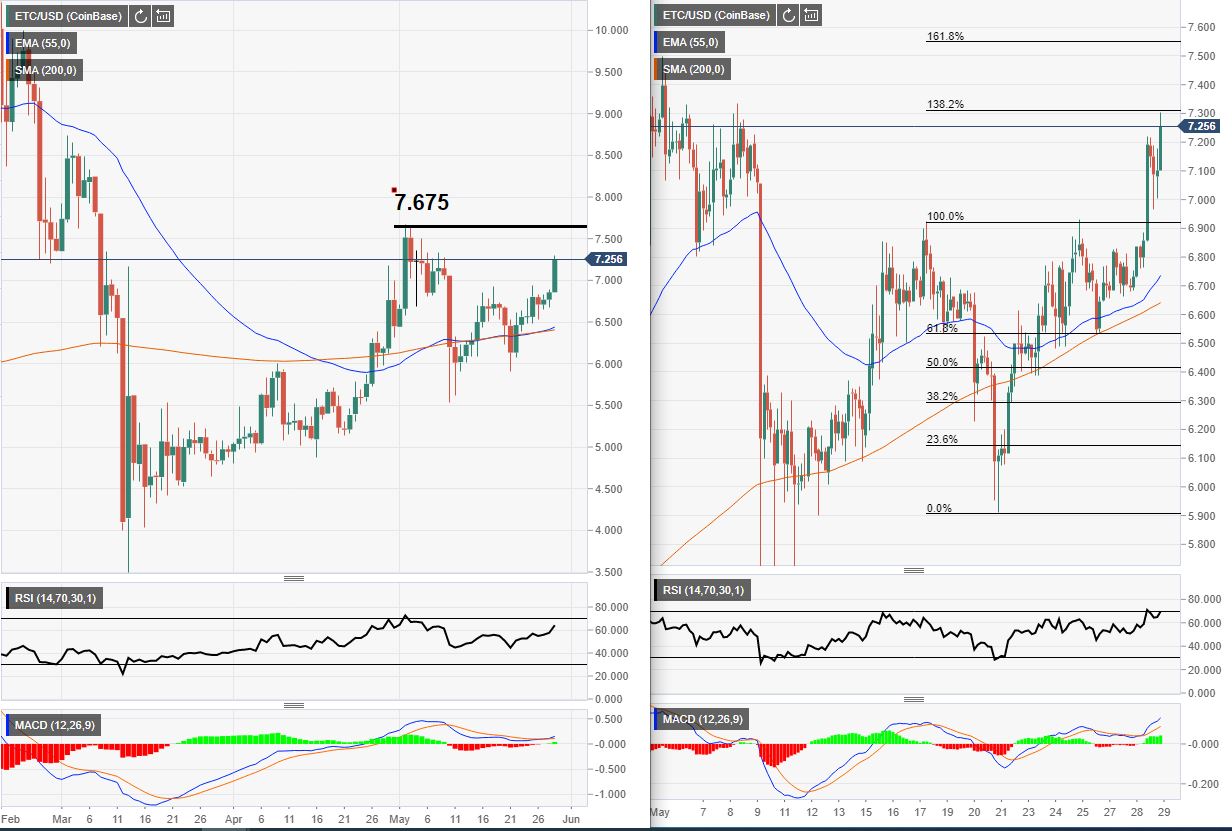
ETC/USD daily and 4-hour chart
On the daily chart on the left, you can see where the wave high of 7.675 lies. This look like it could be the potential target for the bulls after the previous wave high on the 4-hour chart on the right was taken out on Friday.
The 7.00 psychological level has now been broken and the price came back and used the level as support on the 4-hour for a move higher. One of the key features on the chart is the Fib extension on the right-hand chart. The price could push to reach the 161.8% golden Fibonacci ratio and this confluences pretty close to the resistance target of the daily chart (left).
Looking at the indicators, the daily chart Relative Strength Index (RSI) shows there is some space for a move to the upside. However, the 4-hour RSI is in an oversold positive meaning there could be a short term correction before the underlying trend continues.
The MACD on both charts are looking positive with the histogram above the zero-lines and the signal lines over the mid area on both charts. The trend is looking good overall but the daily chart will need a break of 7.675 for confirmation.
Additional levels
Information on these pages contains forward-looking statements that involve risks and uncertainties. Markets and instruments profiled on this page are for informational purposes only and should not in any way come across as a recommendation to buy or sell in these assets. You should do your own thorough research before making any investment decisions. FXStreet does not in any way guarantee that this information is free from mistakes, errors, or material misstatements. It also does not guarantee that this information is of a timely nature. Investing in Open Markets involves a great deal of risk, including the loss of all or a portion of your investment, as well as emotional distress. All risks, losses and costs associated with investing, including total loss of principal, are your responsibility. The views and opinions expressed in this article are those of the authors and do not necessarily reflect the official policy or position of FXStreet nor its advertisers.