EOS price presents a good long term buying opportunity
|
- EOS price is up 15% after breaking out from above a falling wedge pattern.
- EOS could reclaim the September 22 highs at $1.869, the target objective of the pattern, if bullish momentum rises.
- The bullish thesis will be invalidated if the price breaks and closes below the $0.640 support.
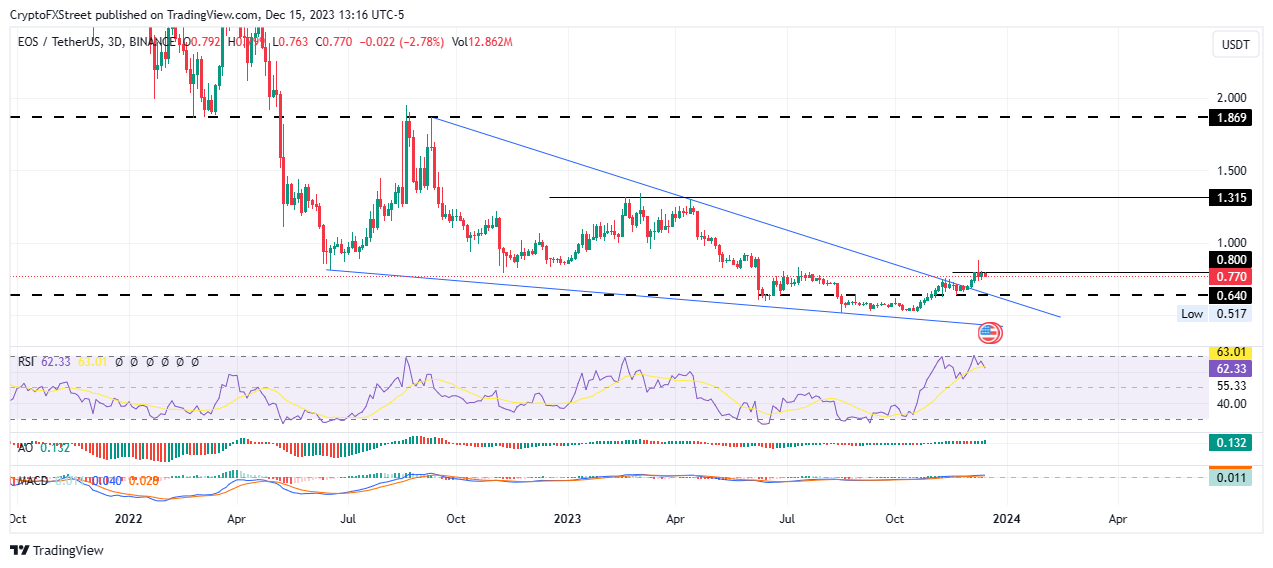
Eos (EOS) price is attempting a recovery rally after a multi-month fall, all the while consolidation below a descending trendline. Recording lower highs and lower lows, the price action culminated in a falling wedge pattern but has since vindicated itself with the potential for more gains.
Also Read: Ethereum leads altcoins north as Bitcoin halts amid bull trap fears
EOS price consolidates around $0.800, a good buying opportunity
EOS (EOS) price actions since September 2022 has resulted in the formation of a falling wedge pattern. This technical formation is a reversal chart pattern that changes the bearish trend into a bullish trend. It is formed when the price bounces between two downward-sloping, converging trendlines.
The ideal place to set a target once the price breaks above a falling wedge will be at the upper level where the falling wedge started from, with a stop loss a few pips below the final low before the breakout occurred. Setting the target objective at $1.869 in the 3-day chart for the EOS/USDT trading pair, the ongoing consolidation could be a good buying opportunity for long-term traders looking to capitalize on a possible 140% climb.
Increased buying pressure above current levels could see the EOS price extend past the $1.00 psychological level to test the 1.315 resistance level. Such a move would constitute a 70% climb above current levels.
In a highly bullish case, the gains could see EOS price flip the $1.315 roadblock into a support floor and use it as the springboard toward the $1.869 resistance level.
The position of the Relative Strength Index (RSI) above the 50 level points to strong price strength, with the green histogram bars of the Awesome Oscillator (AO) in the positive territory adding credence to the bullish outlook.
Also, the Moving Average Convergence Divergence (MACD) indicator is moving above the signal line, showing that the bulls continue to lead the EOS market.
EOS/USDT 1-day chart
On the flip side, if the $0.800 level holds as resistance, the EOS price could pull south, with the rejection likely to see the price test the $0.640 support level. A break and close below this buyer congestion zone would invalidate the prevailing bullish outlook.
Information on these pages contains forward-looking statements that involve risks and uncertainties. Markets and instruments profiled on this page are for informational purposes only and should not in any way come across as a recommendation to buy or sell in these assets. You should do your own thorough research before making any investment decisions. FXStreet does not in any way guarantee that this information is free from mistakes, errors, or material misstatements. It also does not guarantee that this information is of a timely nature. Investing in Open Markets involves a great deal of risk, including the loss of all or a portion of your investment, as well as emotional distress. All risks, losses and costs associated with investing, including total loss of principal, are your responsibility. The views and opinions expressed in this article are those of the authors and do not necessarily reflect the official policy or position of FXStreet nor its advertisers.
