Dogecoin whales surge by 50% in 30 days, here’s what this means for DOGE
|
- Dogecoin wallet addresses with greater than 10 billion DOGE climbed by 50% in the last 30 days, per IntoTheBlock data.
- Nearly 48% of the wallet addresses holding Dogecoin are currently sitting on unrealized losses.
- DOGE could extend gains by 12% and revisit $0.1145.
Dogecoin (DOGE), the largest meme coin in the crypto ecosystem noted a surge in whale wallet holdings. Data from on-chain intelligence tracker IntoTheBlock show a 50% increase in the count of wallet addresses holding over 10 billion DOGE.
DOGE trades at $0.10227 at the time of writing.
Dogecoin whales scoop up the meme coin during dip
In the last 30 days, through the crypto market crash, large wallet investors accumulated Dogecoin. Wallets with over 10 billion DOGE tokens have increased by 50% per IntoTheBlock data.
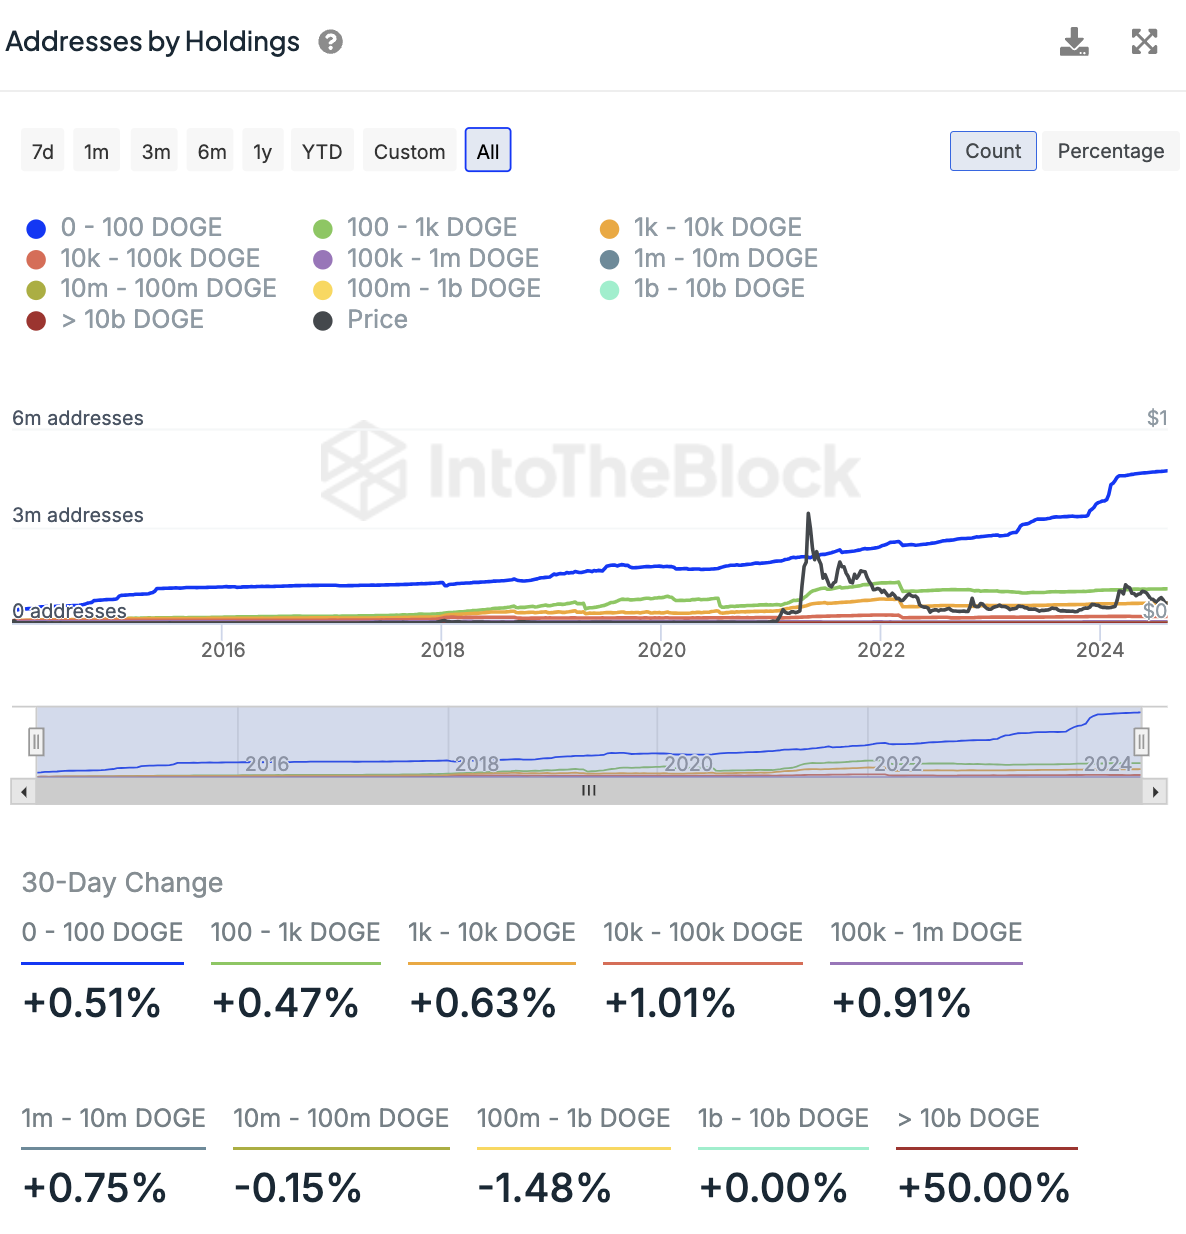
Dogecoin addresses by holdings 30-day change
The chart above shows slight changes in wallets holding different volumes of DOGE tokens. An increase in whale wallet holdings is a positive sign for the asset, when combined with decrease in selling pressure.
Data from the Global In/Out of the Money (GIOM) metric shows that nearly 48% of the wallet addresses holding Dogecoin are currently sitting on unrealized losses. Typically, a wallet holder is less likely to realize a loss, reducing the selling pressure on the asset.
DOGE trades at $0.10227 at the time of writing.
Dogecoin could rally 12%
Dogecoin dipped from its March 28 peak of $0.2288 to the August 5 low of $0.08050. In its recovery, DOGE is expected to extend gains towards key support for February to July 2024, a 12% rally.
The DOGE/USDT daily chart below shows Moving Average Convergence Divergence (MACD) indicator flashes green histogram bars above the neutral line, meaning there is positive underlying momentum in Dogecoin price trend.
DOGE/USDT daily chart
Dogecoin could find support in the Fair Value Gap (FVG) between $0.09000 and $0.09400, in the event of a correction.
Cryptocurrency metrics FAQs
The developer or creator of each cryptocurrency decides on the total number of tokens that can be minted or issued. Only a certain number of these assets can be minted by mining, staking or other mechanisms. This is defined by the algorithm of the underlying blockchain technology. Since its inception, a total of 19,445,656 BTCs have been mined, which is the circulating supply of Bitcoin. On the other hand, circulating supply can also be decreased via actions such as burning tokens, or mistakenly sending assets to addresses of other incompatible blockchains.
Market capitalization is the result of multiplying the circulating supply of a certain asset by the asset’s current market value. For Bitcoin, the market capitalization at the beginning of August 2023 is above $570 billion, which is the result of the more than 19 million BTC in circulation multiplied by the Bitcoin price around $29,600.
Trading volume refers to the total number of tokens for a specific asset that has been transacted or exchanged between buyers and sellers within set trading hours, for example, 24 hours. It is used to gauge market sentiment, this metric combines all volumes on centralized exchanges and decentralized exchanges. Increasing trading volume often denotes the demand for a certain asset as more people are buying and selling the cryptocurrency.
Funding rates are a concept designed to encourage traders to take positions and ensure perpetual contract prices match spot markets. It defines a mechanism by exchanges to ensure that future prices and index prices periodic payments regularly converge. When the funding rate is positive, the price of the perpetual contract is higher than the mark price. This means traders who are bullish and have opened long positions pay traders who are in short positions. On the other hand, a negative funding rate means perpetual prices are below the mark price, and hence traders with short positions pay traders who have opened long positions.
Information on these pages contains forward-looking statements that involve risks and uncertainties. Markets and instruments profiled on this page are for informational purposes only and should not in any way come across as a recommendation to buy or sell in these assets. You should do your own thorough research before making any investment decisions. FXStreet does not in any way guarantee that this information is free from mistakes, errors, or material misstatements. It also does not guarantee that this information is of a timely nature. Investing in Open Markets involves a great deal of risk, including the loss of all or a portion of your investment, as well as emotional distress. All risks, losses and costs associated with investing, including total loss of principal, are your responsibility. The views and opinions expressed in this article are those of the authors and do not necessarily reflect the official policy or position of FXStreet nor its advertisers.