Dogecoin price sets for a rally following retest of support level
|
- Dogecoin price faces rejection at the 50% Fibonacci retracement.
- On-chain data shows that DOGE's development activity is growing, suggesting a bullish move ahead.
- A daily candlestick close below $0.1018 would invalidate the bullish move.
Dogecoin (DOGE) is encountering resistance at 50% Fibonacci retracement at $0.1420 and is now retracing towards a weekly support level. At the time of writing, DOGE decreases by 2.3% to $0.1363 on Tuesday. On-chain data indicating increased development activity suggests a potential bullish trend ahead for DOGE.
Dogecoin price looks promising
Dogecoin price is retracing toward the $0.1182 weekly support level after rejection at the 50% Fibonacci retracement at $0.1420, drawn from a swing low of $0.0556 on August 17, 2023, to a swing high of $0.2284 on March 28.
If DOGE bounces off the $0.1182 weekly support level, it could rally 20% and tag the resistance level of $0.1420.
This bounce is supported by indicators like the Relative Strength Index (RSI) and Awesome Oscillator (AO) on the daily chart, both comfortably above their respective mean levels of 50 and 0. These momentum indicators strongly indicate bullish dominance.
If bullish sentiment prevails and the overall cryptocurrency market outlook remains optimistic, the Dogecoin price could close above the $0.1420 mark, potentially continuing its rally by 20% to challenge its next weekly resistance at $0.1714.
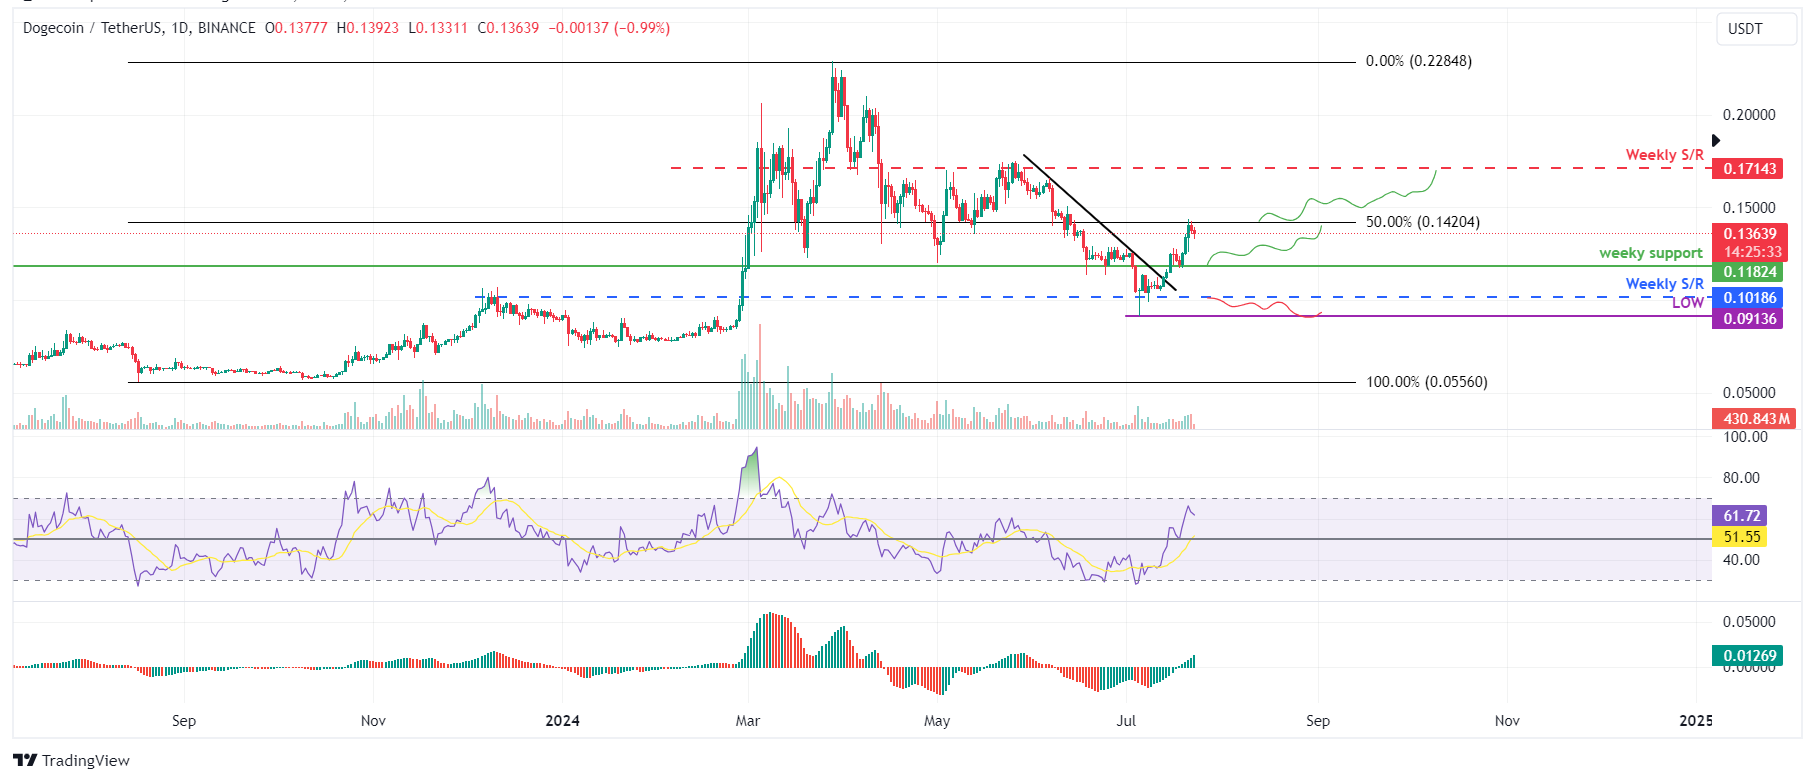
DOGE/USDT daily chart
Based on IntoTheBlock's Global In/Out of the Money (GIOM), nearly 194,960 addresses accumulated 51.37 billion DOGE tokens at an average price of $0.1168. These addresses bought the dog-based meme token between $0.0998 and $0.1334, which makes it a key support zone.
Interestingly, the zone mentioned from a technical analysis perspective, the $0.1182 level, coincides with the GIOM findings, making this zone a key reversal area to watch.
DOGE GIOM chart
Santiment's Development Activity index shows project development activity over time based on several pure development-related events in the project's public GitHub repository. In DOGE's case, a sharp rise in the index from 2.64 on July 12 to 4.5 on Tuesday implies that the Dogecoin price developing activity is high, which adds further credence to the bullish outlook.
DOGE Development Activity chart
Despite the bullish thesis signaled by both on-chain data and technical analysis, if the DOGE's daily candlestick breaks below $0.1018, the outlook would shift to bearish. This scenario could lead to a crash of 10% to the July 5 low of $0.0913.
Information on these pages contains forward-looking statements that involve risks and uncertainties. Markets and instruments profiled on this page are for informational purposes only and should not in any way come across as a recommendation to buy or sell in these assets. You should do your own thorough research before making any investment decisions. FXStreet does not in any way guarantee that this information is free from mistakes, errors, or material misstatements. It also does not guarantee that this information is of a timely nature. Investing in Open Markets involves a great deal of risk, including the loss of all or a portion of your investment, as well as emotional distress. All risks, losses and costs associated with investing, including total loss of principal, are your responsibility. The views and opinions expressed in this article are those of the authors and do not necessarily reflect the official policy or position of FXStreet nor its advertisers.