Dogecoin Price Prediction: DOGE plans to retest all-time highs
|
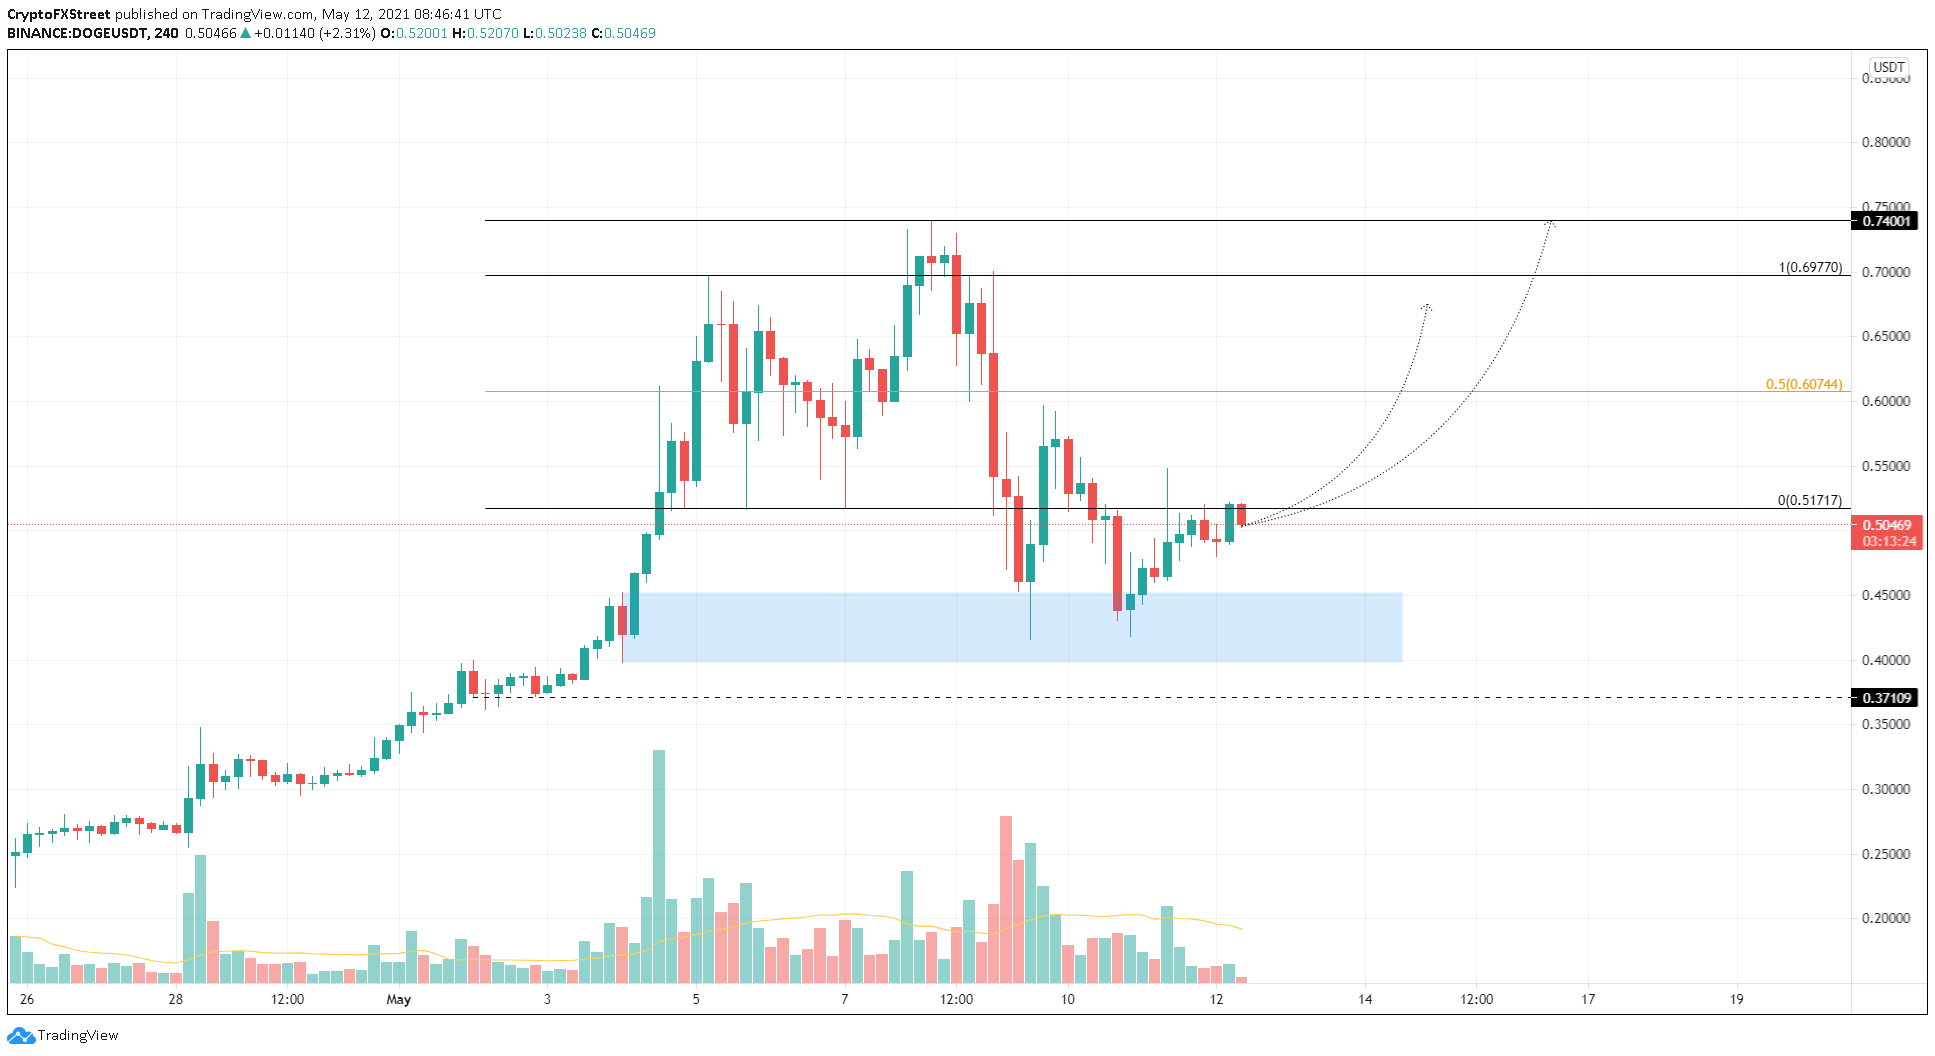
- Dogecoin price has successfully bounced off the $0.397 to $0.451 demand barrier, hinting at an incipient upswing.
- A continuation of this momentum could push DOGE to $0.697 and $0.740.
- Breakdown of the support level at $0.371 will invalidate the bullish thesis.
Dogecoin price is showing a clean bounce off a critical support area, indicating a resurgence of buyers. The upswing could propel the meme-themed cryptocurrency toward its range high.
Dogecoin price prepares for a blastoff
On the 4-hour chart, Dogecoin price has tapped into the liquidity available at the demand zone, extending from $0.397 to $0.451. As a result, DOGE has rallied nearly 20% to where it is trading at the time of writing, $0.498.
Dogecoin price could retest the aforementioned support area before proceeding to surge toward the 50% Fibonacci retracement level at $0.607, which is the first area of interest.
Following this, the meme coin could climb 15% to tag the $0.67 level, the range high.
If the bullish momentum persists after hitting this level, investors can expect Dogecoin price to rally to its all-time high at $0.739.
DOGE/USDT 4-hour chart
Supporting this bullish scenario is IntoTheBlock’s In/Out of the Money Around Price (IOMAP) model, which shows a stable support barrier at $0.497. Here roughly, 137,000 addresses previously purchased 14.3 billion DOGE. Therefore, these investors might add more to their holdings if the price dips lower and dampen the selling pressure.
Moreover, the resistance levels present ahead for Dogecoin price is relatively small. Surpassing $0.561, where 60,000 addresses that bought 5.2 billion DOGE are underwater, will provide the bulls a safe passage to the abovementioned levels.
DOGE IOMAP chart
While things seem to be looking up for Dogecoin price, investors should be cautious during the next dip into the demand zone mentioned above. A build of selling pressure that leads to a breakdown of $0.397 will signal a developing bearish outlook.
A decisive 4-hour candlestick close below $0.371 will invalidate the bullish thesis and kickstart a downtrend to $0.349.
Information on these pages contains forward-looking statements that involve risks and uncertainties. Markets and instruments profiled on this page are for informational purposes only and should not in any way come across as a recommendation to buy or sell in these assets. You should do your own thorough research before making any investment decisions. FXStreet does not in any way guarantee that this information is free from mistakes, errors, or material misstatements. It also does not guarantee that this information is of a timely nature. Investing in Open Markets involves a great deal of risk, including the loss of all or a portion of your investment, as well as emotional distress. All risks, losses and costs associated with investing, including total loss of principal, are your responsibility. The views and opinions expressed in this article are those of the authors and do not necessarily reflect the official policy or position of FXStreet nor its advertisers.
