Did Bitcoin top out at $1,08,367? Critical levels to watch
|
1. Current pattern unfolding
-
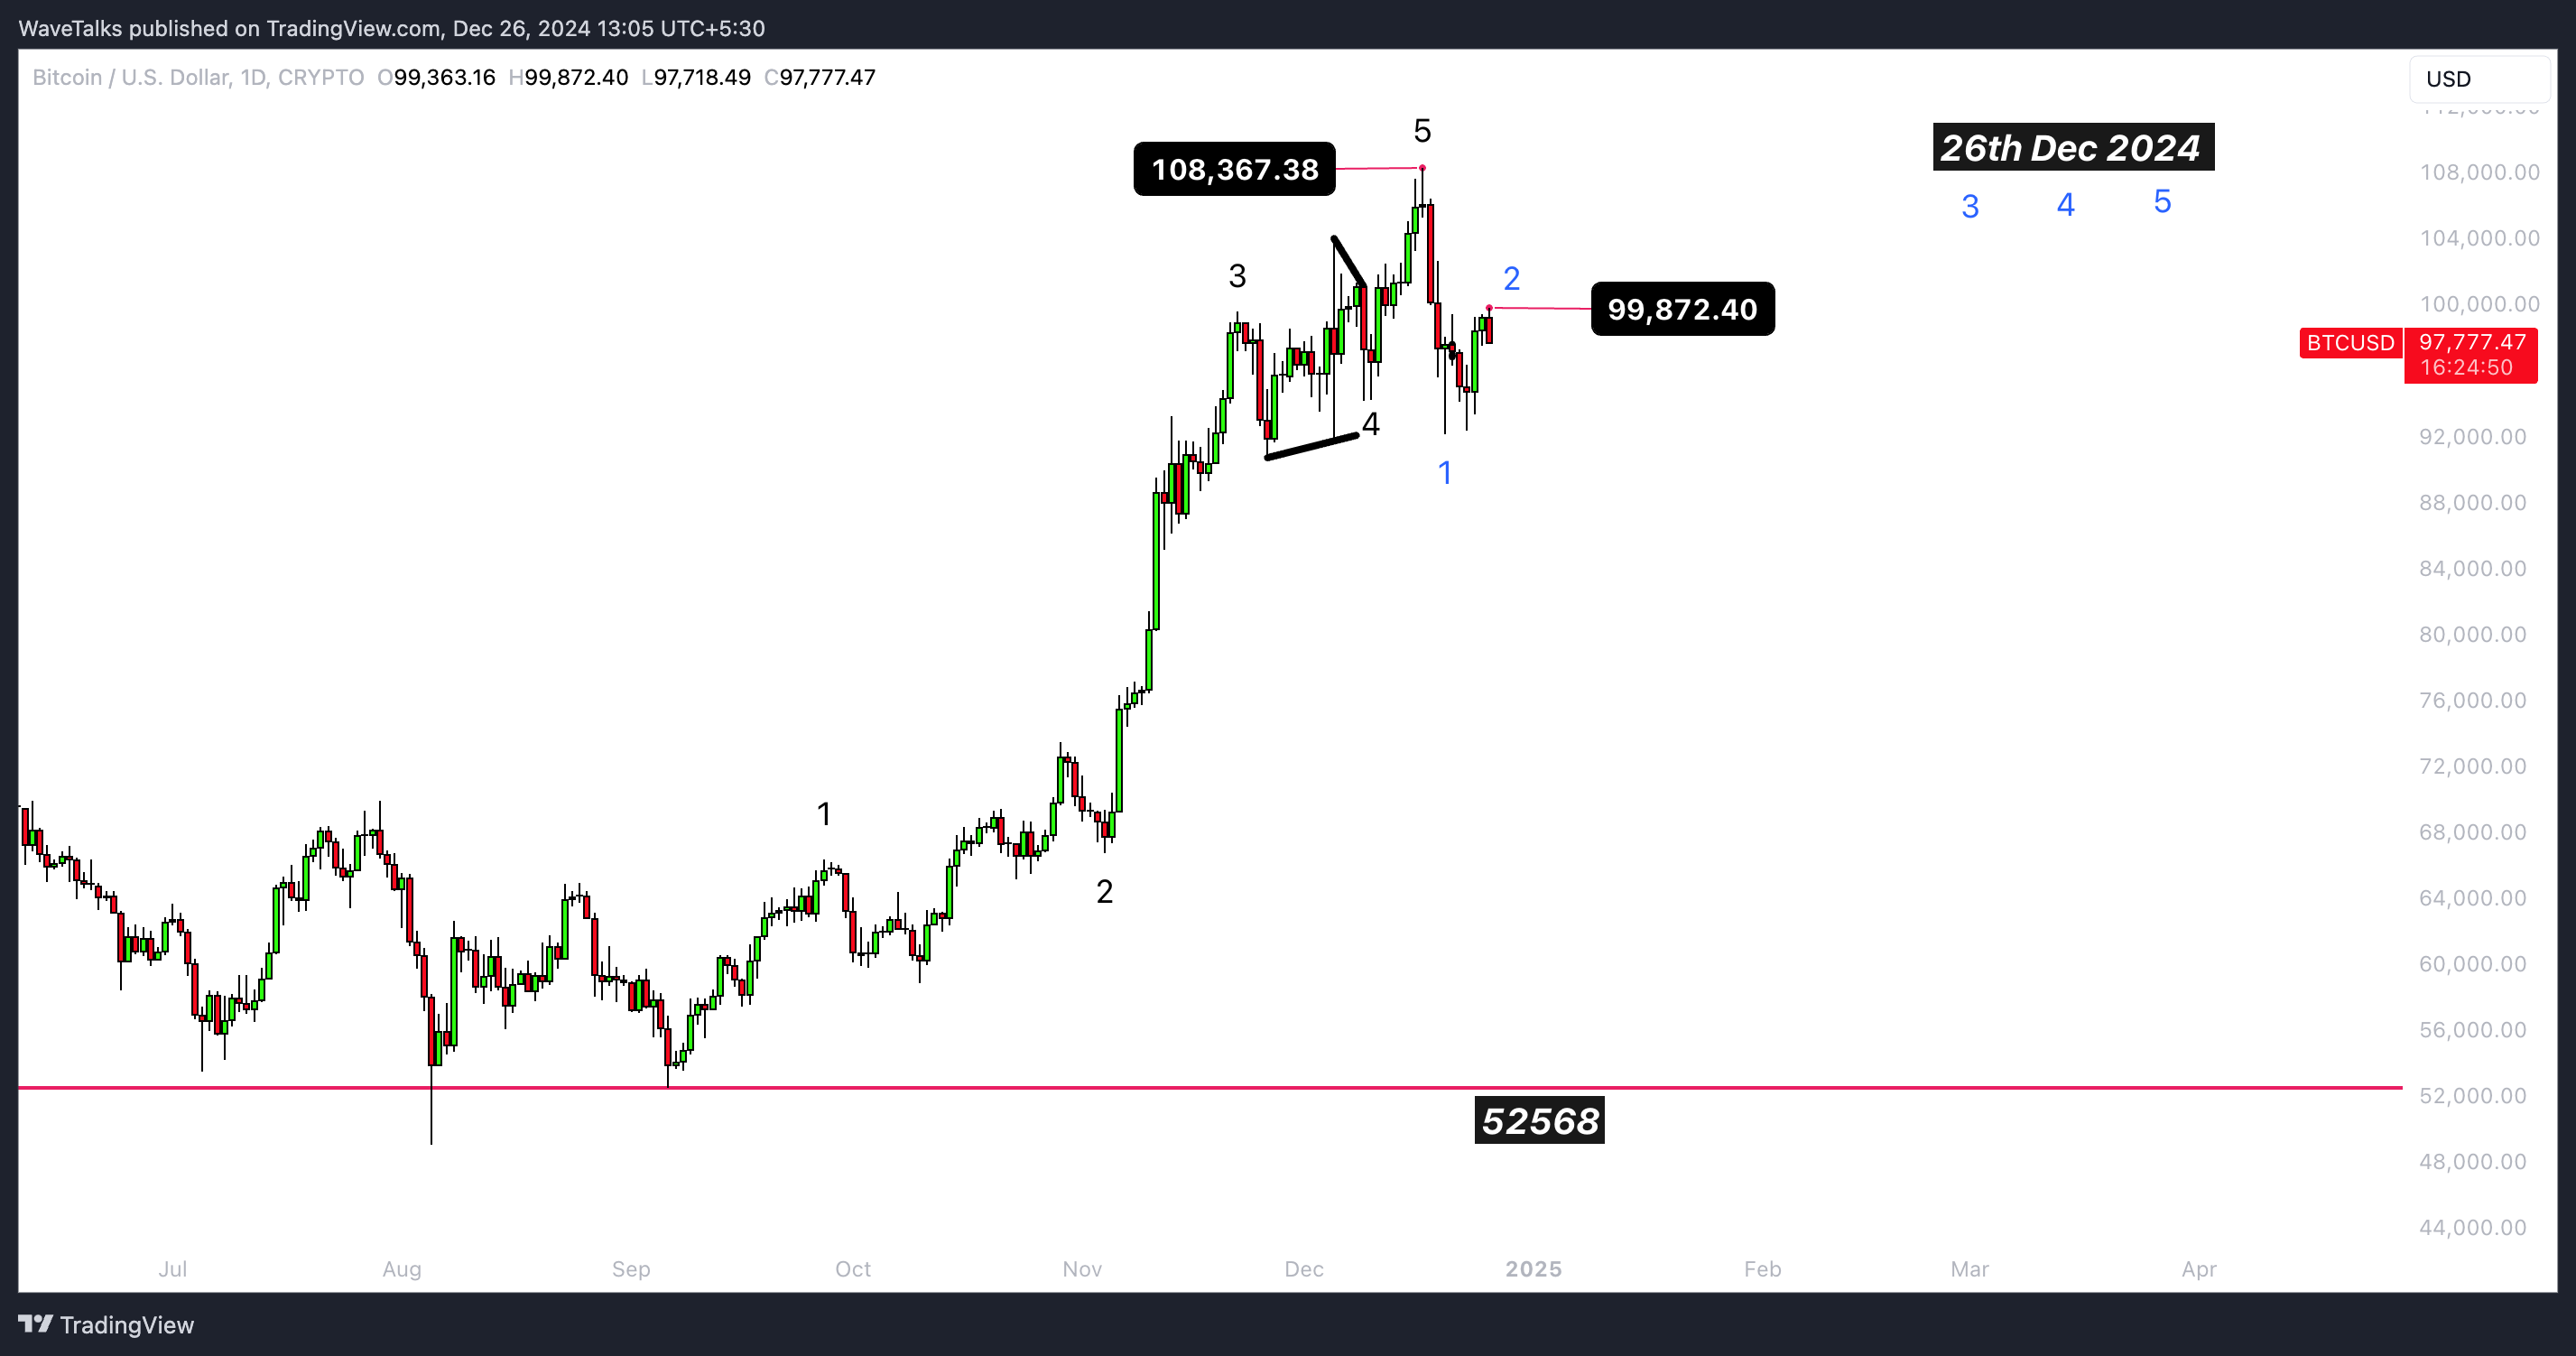
Five-wave rally: The impulsive rally starting from $52,568 appears to have topped out at $1,08,367.
-
V-shape reversal: Bitcoin retraced sharply to $92,209 on 20th Dec 2024.
-
Sideways movement: Over the past 6-7 days, Bitcoin has been in a consolidation phase between $92,209 (lows) and $99,872 (highs), forming a Flat Correction (ABC Wave).
Daily chart - Bitcoin
Key observations
-
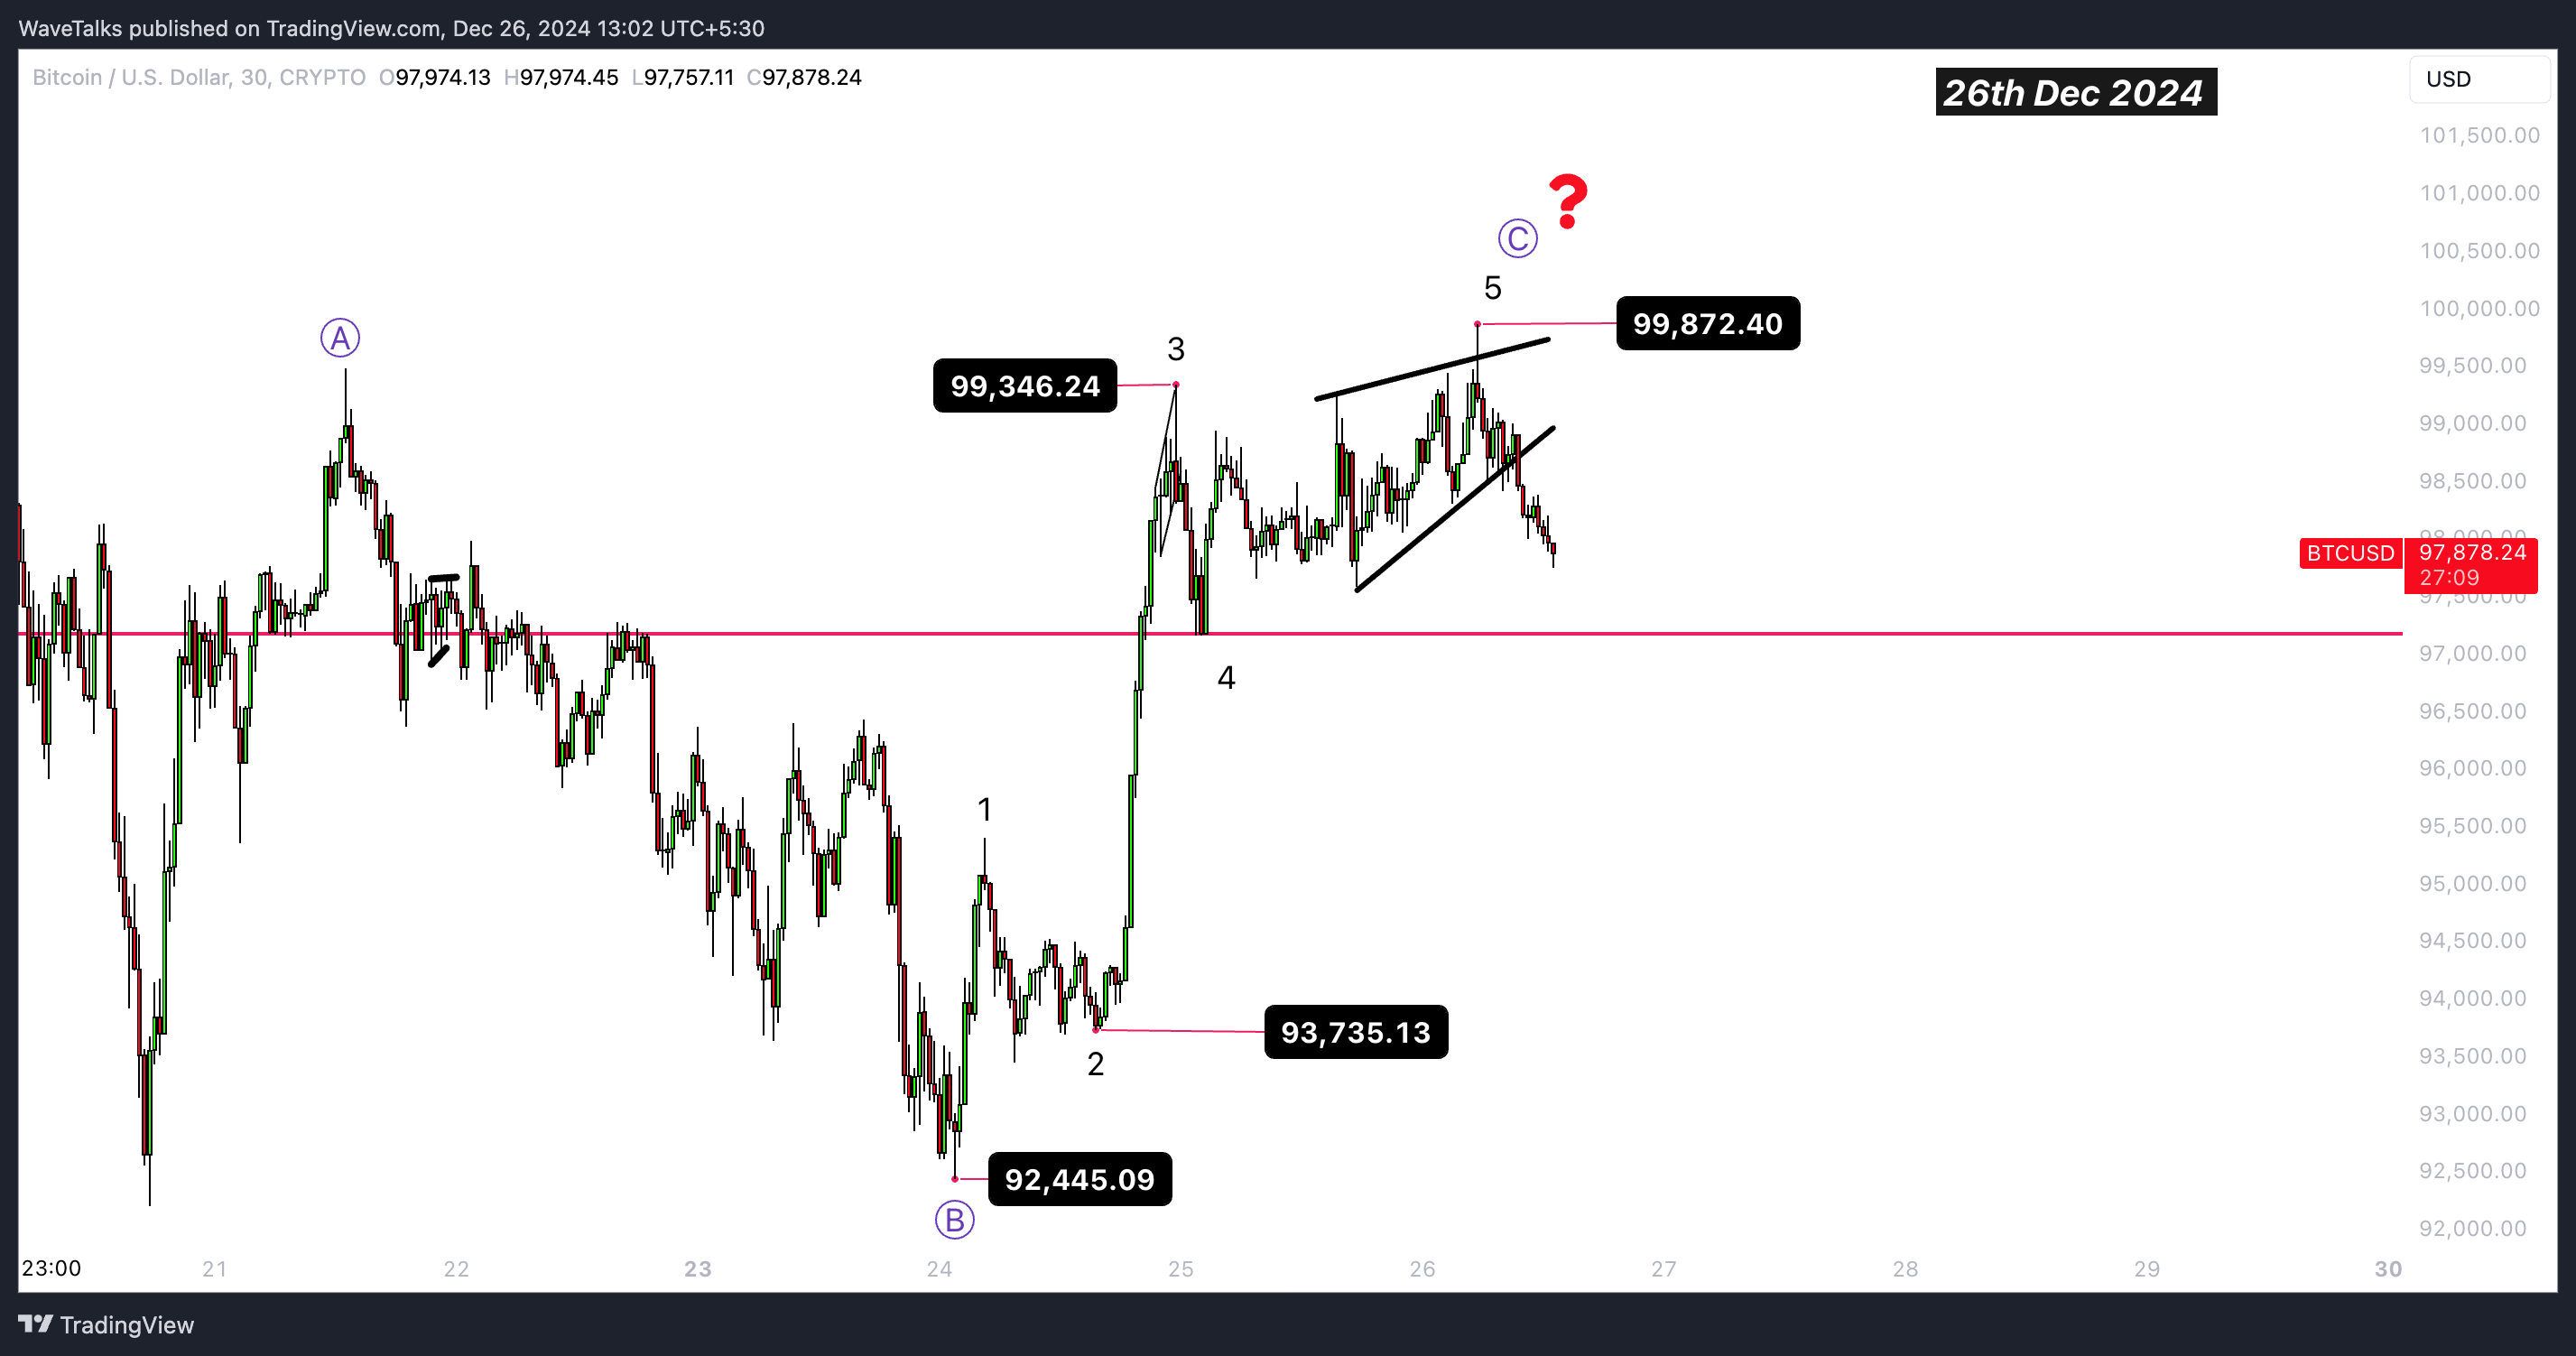
Wave-C: Appears to be an impulsive sequence internally, ending with a Rising Wedge near $99,872.
-
Critical support: $92,209 – the low from 20th Dec 2024.
30 mins chart - Impulsive wave C of flat correction
2. Catching the tops with wave patterns ( 30 mins chart)
- The rising wedge or ending diagonal at $99,872 highs is one of the most rewarding patterns in Elliott Wave analysis.
-
Understanding and applying this pattern effectively allows you to catch tops and prepare for reversals.
-
Key takeaway: If you're on the right side of the pattern—as I was recently—you can reap significant rewards from such setups.
3. Possible strategies
Scenario 1: Fall below $92,209
-
If Bitcoin breaks below $92,209, it could confirm a larger corrective phase.
-
Key downside targets:
-
$83,625: Equality projection of the fall from $1,08,367 to $92,209.
-
$73,555: 162% extension projection of the same move.
-
-
Strategy:
-
Wait for confirmation below $92,209 before entering short positions.
-
Use $92,209 as the invalidation level for bullish positions.
-
Scenario 2: Holding above $92,209
-
Bitcoin may continue its consolidation, eventually breaking higher.
-
Strategy:
-
Monitor for a breakout above $99,872 to confirm a resumption of the uptrend.
-
Target higher levels for Wave-2 correction, with stops below $92,209.
-
4. Outlook for next week (by 3rd Jan 2025)
-
The sideways movement is expected to resolve, providing clear directional cues.
-
Bearish bias: Favored if $92,209 breaks decisively.
-
Bullish potential: A strong hold above $92,209 with a breakout above $99,872 could invalidate the bearish outlook and has to be reviewed again later.
Information on these pages contains forward-looking statements that involve risks and uncertainties. Markets and instruments profiled on this page are for informational purposes only and should not in any way come across as a recommendation to buy or sell in these assets. You should do your own thorough research before making any investment decisions. FXStreet does not in any way guarantee that this information is free from mistakes, errors, or material misstatements. It also does not guarantee that this information is of a timely nature. Investing in Open Markets involves a great deal of risk, including the loss of all or a portion of your investment, as well as emotional distress. All risks, losses and costs associated with investing, including total loss of principal, are your responsibility. The views and opinions expressed in this article are those of the authors and do not necessarily reflect the official policy or position of FXStreet nor its advertisers.

