Cosmos investors save the day as markets navigate through a geopolitical minefield
|
- Cosmos price action breaks below the important green ascending trend line that references the uptrend.
- ATOM price has been paring losses at the time of writing and could see the scale tipping towards profits for today.
- Expect squaring back more losses towards $27.63 and a break above the green trend line if the current recovery continues.
Cosmos (ATOM) price action saw a sharp rejection at a short-term level marked up at $27.63. With that rejection, ATOM has lost 15% of its value but is already paring back losses as markets shift towards risk-on as investors analyse the situation in Ukraine's Donbass as not as precarious as previously thought. Expect to see pop back above the green ascending trend line, making this a false breakout, and then a return to or above $27.63, erasing the complete loss from Monday.
ATOM price shows resilience and could pair back the complete Monday loss
Cosmos price action lost around 15% of value in the market turmoil from Monday after Putin signed decrees to recognize two regions as independent and create an incentive to enter the region with military force under a humanitarian declaration. But for now, there has been no sharp increase in military movement or a significant escalation of violence in the region. That, together with Putin repeatedly saying he wants to keep talking, has led investors to look beyond the short-term impact and trust that this situation will be resolved relatively peacefully.
ATOM is thus a steal at current levels and should only see more investors jump on price action, creating a false breakout and seeing ATOM re-enter space above the green ascending trend line. That would be a perfect bear trap, and see the Relative Strength Index walk away from the oversold area towards more moderate levels around 50. There is plenty of room thus for bulls to navigate price action in ATOM back to $27.63, where the sell-off started on Monday.
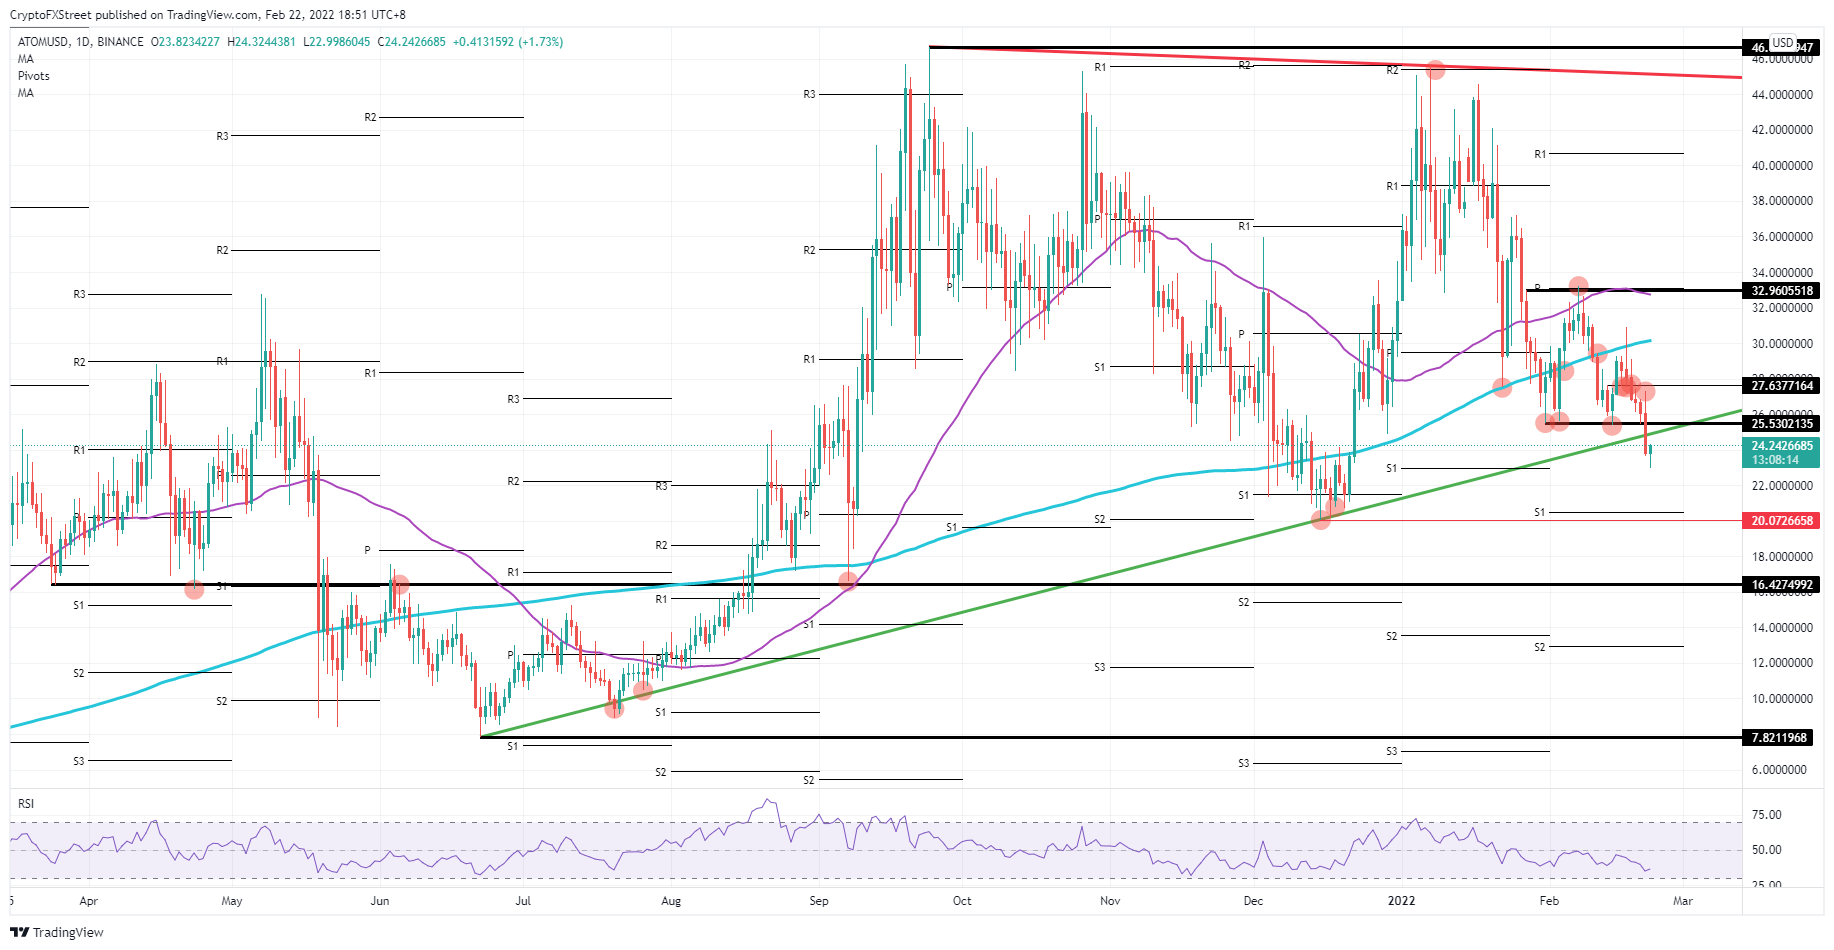
ATOM/USD daily chart
Technically the green ascending trend line could create resistance with a firm rejection. Cosmos price action would then collapse as bears gain control of the price action and push price action towards the $22.00 intermediary before going for that final cut towards $20.07 – the low of December 2021 and the monthly S1 support level just above $20.50. This double barrier should catch any falling knives and refrain ATOM from dropping towards $16.42.

Information on these pages contains forward-looking statements that involve risks and uncertainties. Markets and instruments profiled on this page are for informational purposes only and should not in any way come across as a recommendation to buy or sell in these assets. You should do your own thorough research before making any investment decisions. FXStreet does not in any way guarantee that this information is free from mistakes, errors, or material misstatements. It also does not guarantee that this information is of a timely nature. Investing in Open Markets involves a great deal of risk, including the loss of all or a portion of your investment, as well as emotional distress. All risks, losses and costs associated with investing, including total loss of principal, are your responsibility. The views and opinions expressed in this article are those of the authors and do not necessarily reflect the official policy or position of FXStreet nor its advertisers.