Compound Technical Analysis: COMP/USD explodes 40% towards $270 after a long period of consolidation
|- COMP/USD is now trading at $241 after trading in a slow and descending pattern.
- COMP bulls have been really active in the past week.
The trading volume of COMP has increased massively over the past 24 hours from an average of $55 million to $485 million currently.
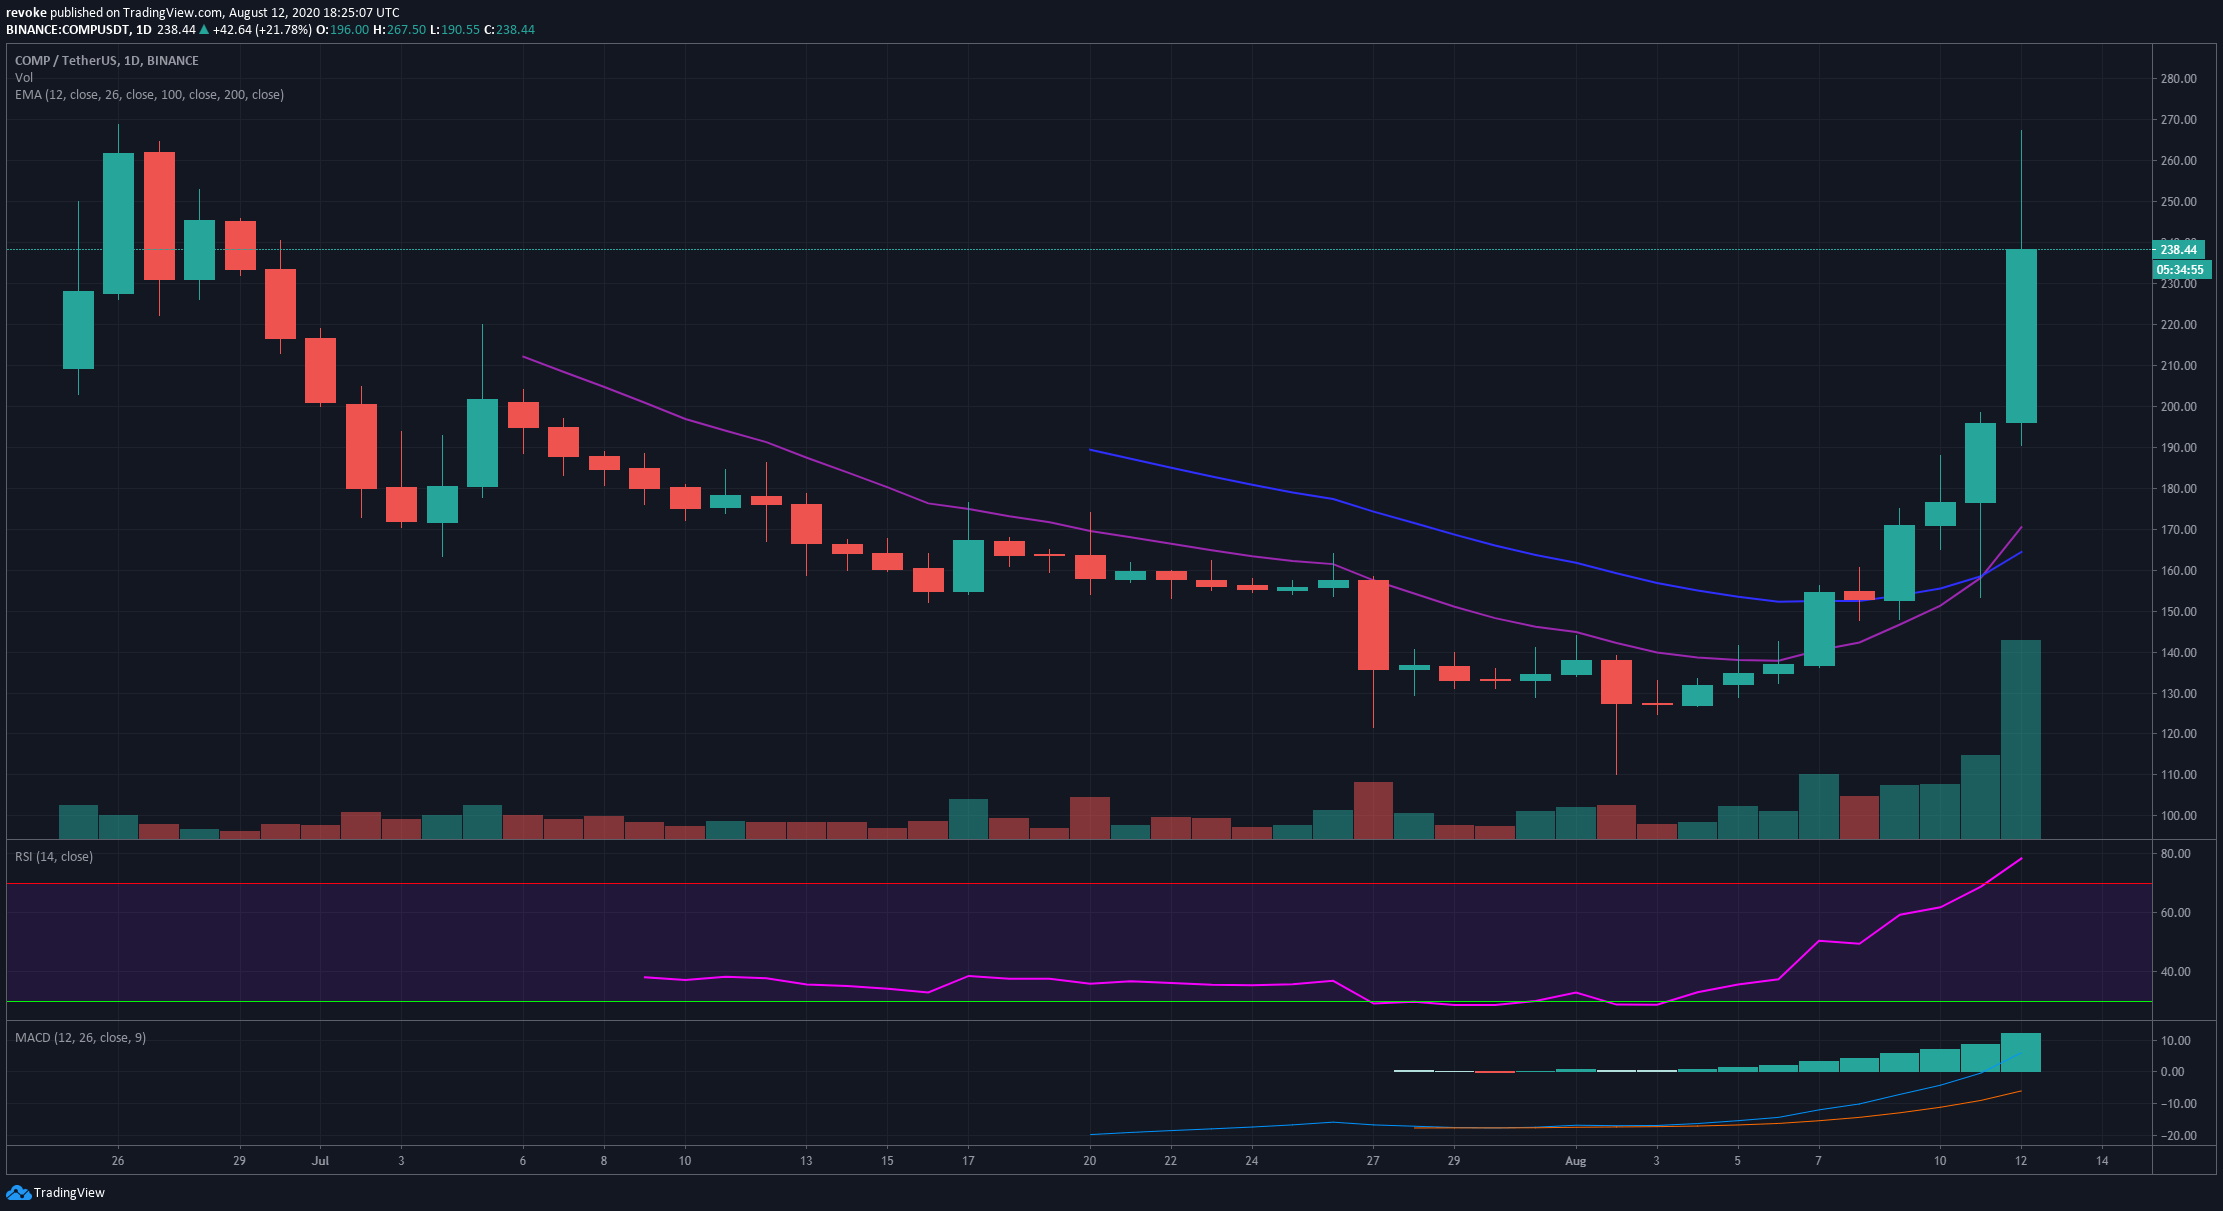
COMP/USD daily chart
COMP was trading below the 12-EMA for weeks. This resistance level became the most crucial one in the short-term and it wasn’t until August 7 that bulls had a significant breakout above both EMAs.
Now the 12-EMA and the 26-EMA have crossed bullishly and COMP is getting a ton of continuation to the upside with a massive increase in trading volume.
Information on these pages contains forward-looking statements that involve risks and uncertainties. Markets and instruments profiled on this page are for informational purposes only and should not in any way come across as a recommendation to buy or sell in these assets. You should do your own thorough research before making any investment decisions. FXStreet does not in any way guarantee that this information is free from mistakes, errors, or material misstatements. It also does not guarantee that this information is of a timely nature. Investing in Open Markets involves a great deal of risk, including the loss of all or a portion of your investment, as well as emotional distress. All risks, losses and costs associated with investing, including total loss of principal, are your responsibility. The views and opinions expressed in this article are those of the authors and do not necessarily reflect the official policy or position of FXStreet nor its advertisers.