Chainlink price rises to new all-time highs while Band Protocol wants to catches up
|-637336005550289133_Small.jpg)
- Chainlink price has hit a new all-time high at $21.45.
- It seems that Band Protocol price has been somewhat correlated with Chainlink for the past few months.
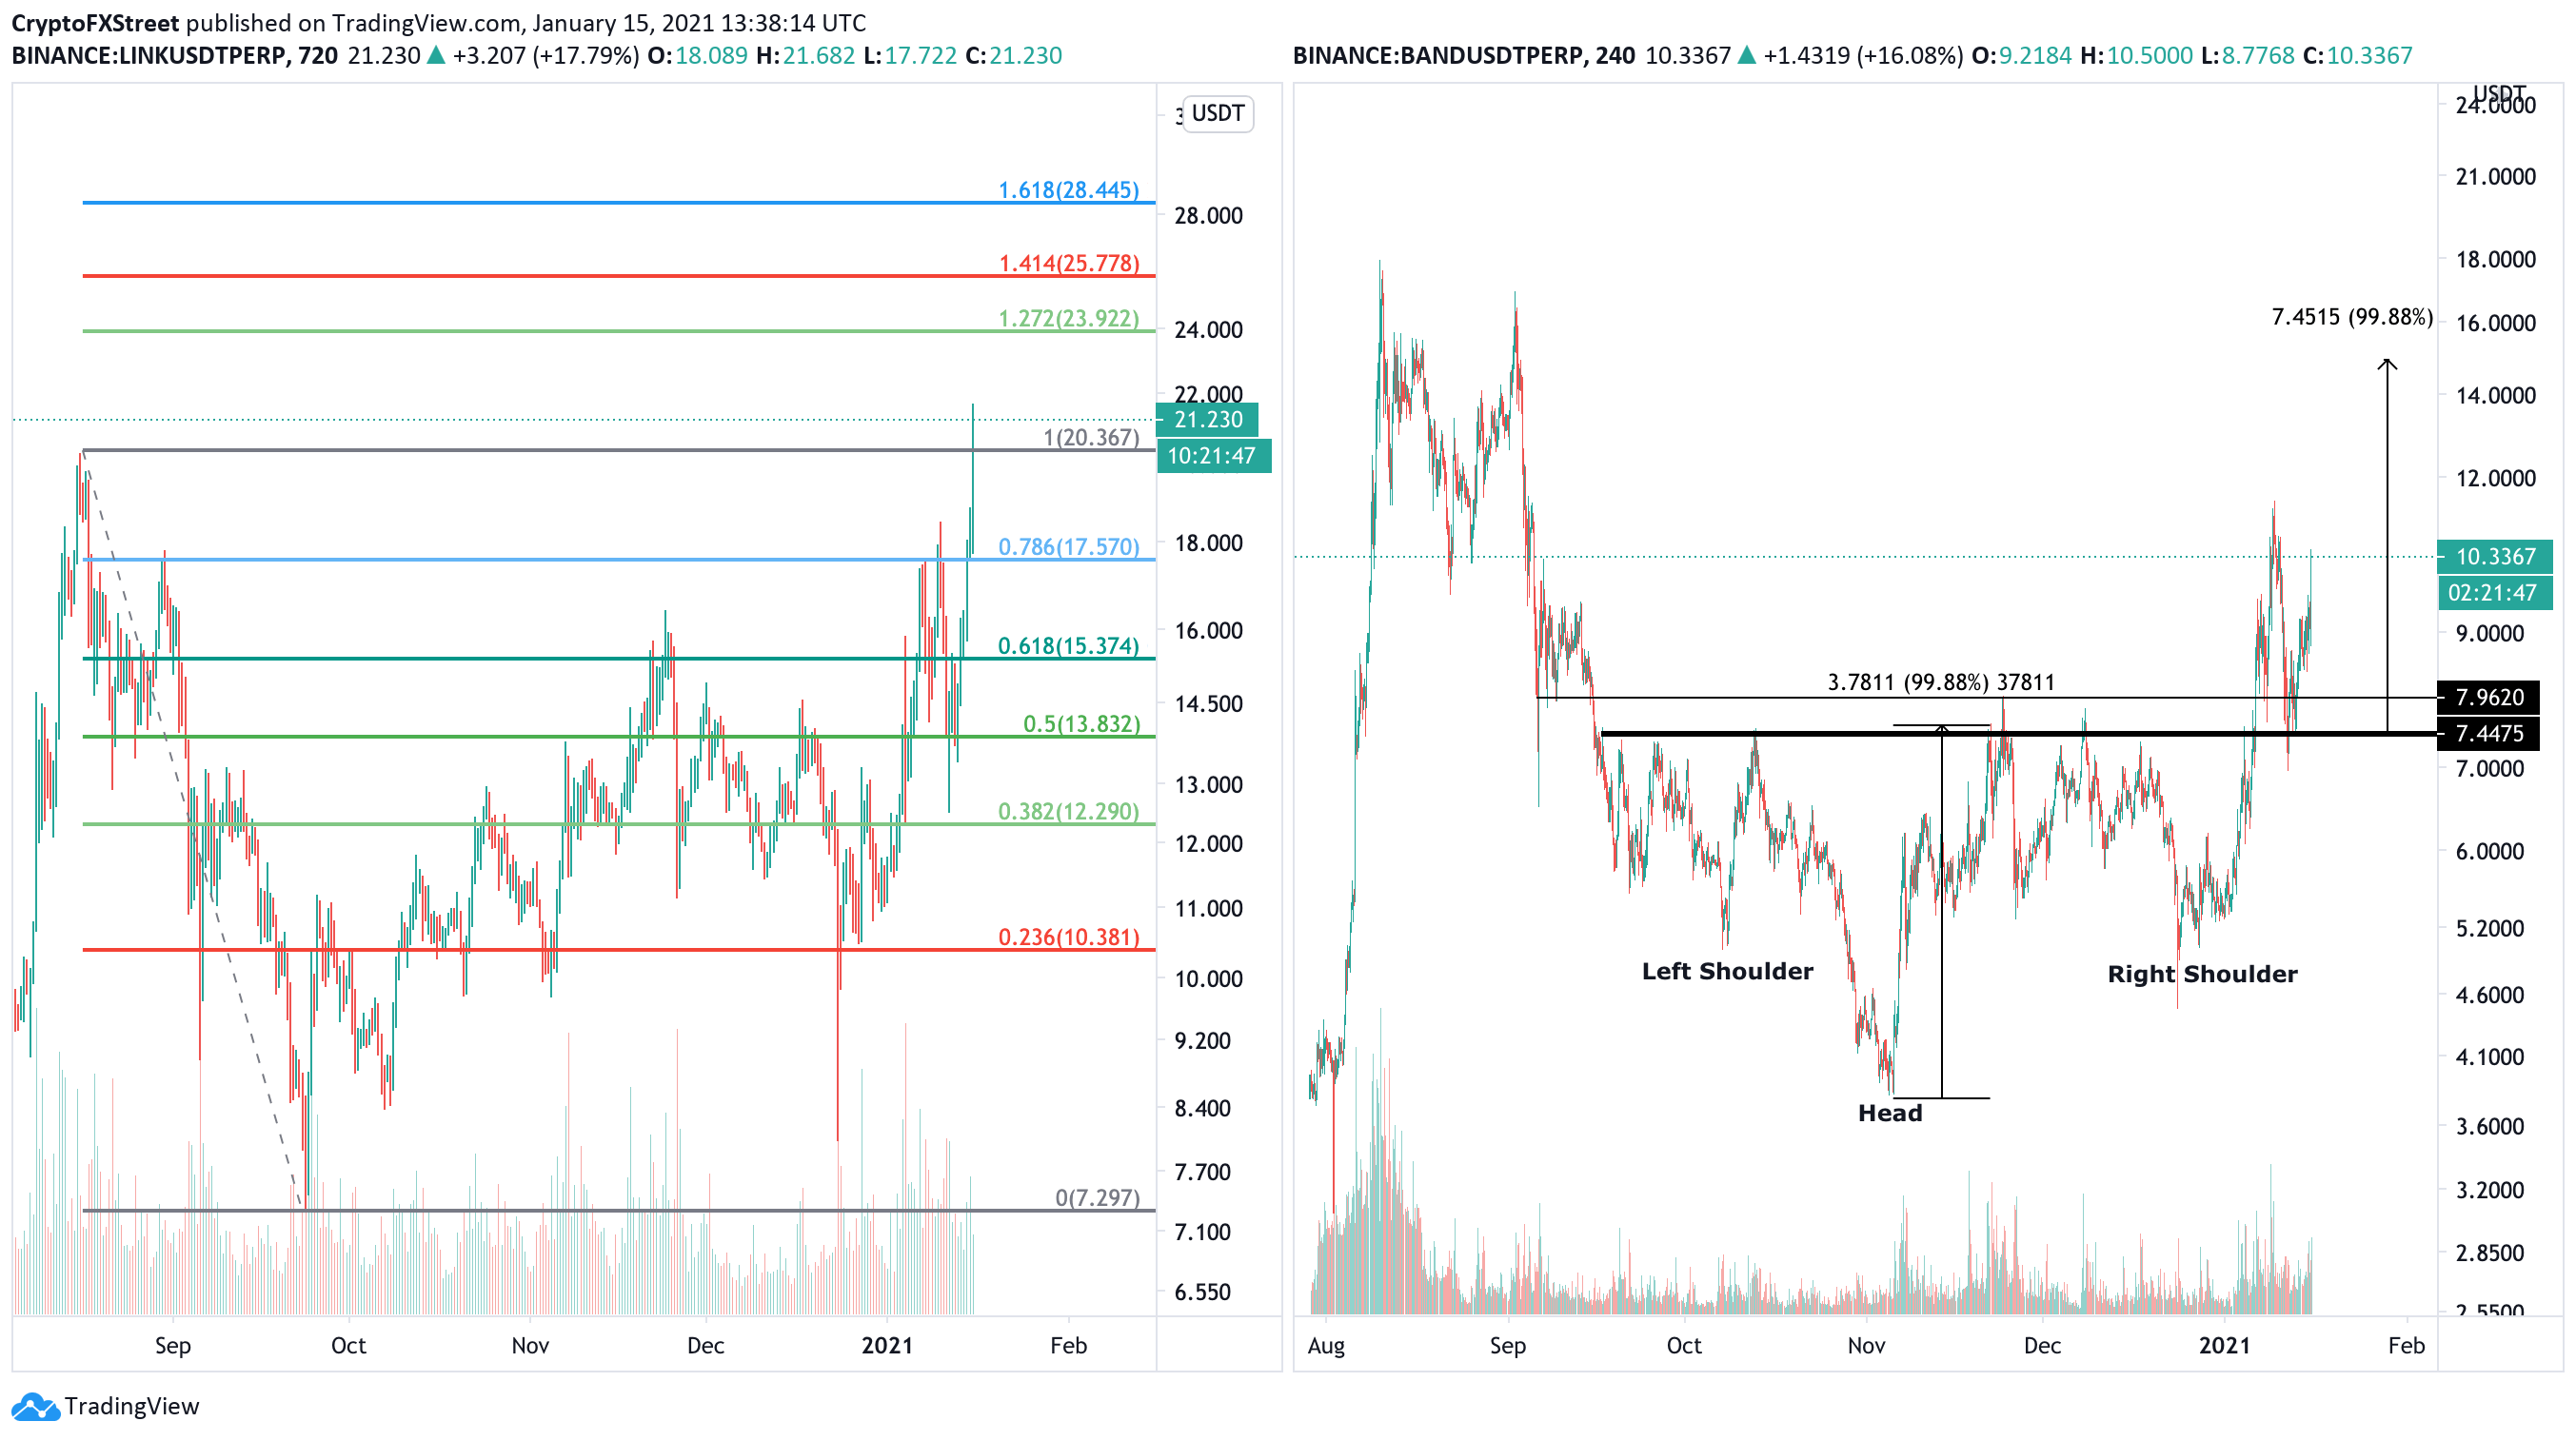
Chainlink has finally established a new all-time high at $21.45 before a brief pullback below $20. The digital asset has been trading inside an uptrend since December 25, 2020. Band Protocol price action has been similar to Chainlink in the past few months and seems to be trying to catch up.
Can Band Protocol also explode to a new all-time high?
On the 12-hour chart of Chainlink, we can see a breakout towards the 100% Fibonacci Level at $20.367 and the next potential price target at $24, which is the 127% level. On the 4-hour chart, Band Protocol price saw a breakout above an inverse head and shoulders pattern with a price target of $15.
LINK vs BAND comparison
Band Protocol price dropped below the initial breakout to retest the neckline resistance level which turned into a support. BAND rebounded and it’s targeting $15 again in the long-term, trying to mimic LINK’s price action.
BAND Holders Distribution
The number of whales holding between 10,000 and 100,000 BAND coins has increased from 36 on December 19, 2020, to 52 currently, which indicates there is a lot of buying pressure behind Band Protocol despite the rise in value.
BAND/USD 1-hour chart
On the 1-hour chart, Band Protocol has established an ascending parallel channel and it’s trading right in the middle. A rejection from the psychological level at $10 could quickly push it down to $9.
Chainlink sell signals
After a massive breakout above $20, the TD Sequential has presented a sell signal on the 6-hour chart and it’s on the verge of doing the same on the 9-hour chart. Validation of both calls could push Chainlink price down to $19 in the short-term.
Information on these pages contains forward-looking statements that involve risks and uncertainties. Markets and instruments profiled on this page are for informational purposes only and should not in any way come across as a recommendation to buy or sell in these assets. You should do your own thorough research before making any investment decisions. FXStreet does not in any way guarantee that this information is free from mistakes, errors, or material misstatements. It also does not guarantee that this information is of a timely nature. Investing in Open Markets involves a great deal of risk, including the loss of all or a portion of your investment, as well as emotional distress. All risks, losses and costs associated with investing, including total loss of principal, are your responsibility. The views and opinions expressed in this article are those of the authors and do not necessarily reflect the official policy or position of FXStreet nor its advertisers.
