Cardano price attempts to slice through a massive supply barrier aiming for $0.11
|- Cardano price is bounded by the 50-SMA and the 200-SMA on the daily chart.
- The TD Sequential indicator has presented a buy signal that suggests the price of ADA can climb higher.
For the past two months, the price of ADA has been contained between two major horizontal lines, one at $0.112 and the second at $0.089, only sliding through the support on September 21, to quickly recover four days later.
ADA bulls are currently fighting to stay above the daily 200-SMA, currently around $0.095, and to break the significant resistance area between $0.096 and $0.097, which would clearly shift the odds in favor of the buyers.
ADA attempts to penetrate a massive resistance area
On the daily chart, the most important short-term indicator for the bulls is the buy signal presented by the TD Sequential indicator on November 3. The last buy signal on September 22 was followed by a 31% price increase. The current price of ADA is $0.097, just above the 200-SMA at $0.095, which is acting as a healthy support level.
ADA/USD daily chart
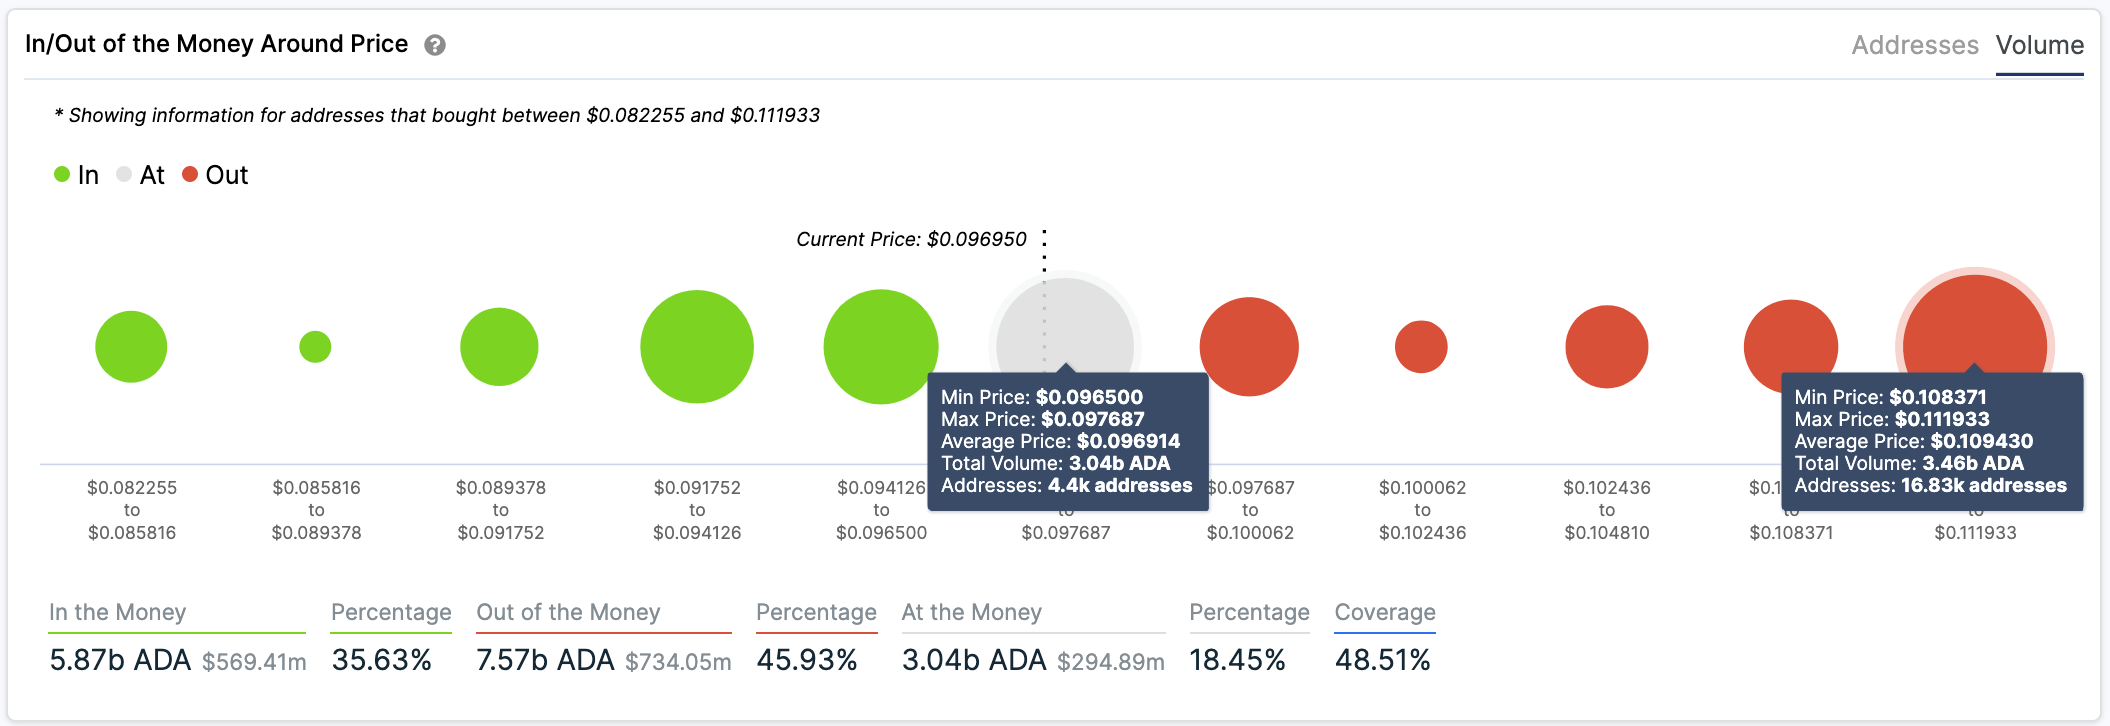
The 50-SMA has been acting as a strong resistance level, and it's located at $0.098. It almost coincides with the robust resistance area between $0.096 and $0.097, which can be flagged using the In/Out of the Money Around Price (IOMAP) chart.
ADA IOMAP chart
In this area, 3.04 billion ADA coins were purchased by 4,400 different addresses, representing a considerable supply barrier. Above this range, those investors would be at a positive ROI (return on investing) and will likely take some profit, increasing the selling pressure. The next significant area seems to be between $0.108 and $0.112, which coincides with the upper horizontal line on the daily chart.
On the other hand, a loss of the 200-SMA at $0.095 can easily drive ADA's price towards the lower horizontal line at $0.089. The IOMAP chart shows very little support below this point, which means ADA price could continue falling towards $0.08.
Information on these pages contains forward-looking statements that involve risks and uncertainties. Markets and instruments profiled on this page are for informational purposes only and should not in any way come across as a recommendation to buy or sell in these assets. You should do your own thorough research before making any investment decisions. FXStreet does not in any way guarantee that this information is free from mistakes, errors, or material misstatements. It also does not guarantee that this information is of a timely nature. Investing in Open Markets involves a great deal of risk, including the loss of all or a portion of your investment, as well as emotional distress. All risks, losses and costs associated with investing, including total loss of principal, are your responsibility. The views and opinions expressed in this article are those of the authors and do not necessarily reflect the official policy or position of FXStreet nor its advertisers.