Bitcoin Weekly Forecast: Is BTC out of the woods?
Premium|
Take advantage of 75% OFF on your first month.
Only $9.99 on your first month! And access to all our articles and insights.
You have reached your limit of 5 free articles for this month.
Take advantage of the Special Price just for today!
Only $9.99 on your first month! And access to all our articles and insights.
UNLOCK OFFER- Bitcoin price shows signs of continuing its uptrend, providing a buying opportunity between $64,580 to $63,095.
- On-chain metrics forecast a bullish outlook for BTC ahead.
- If BTC clears $70,000, the chances of resuming the uptrend would skyrocket.
Bitcoin (BTC) price action in the past two days has confirmed the resumption of the bull run. However, BTC needs to clear a few key hurdles before investors can go all-in.
Also read: Is the crypto bull run back?
Bitcoin price top-down analysis
Looking at the weekly chart, it looks like Bitcoin price could go either way. While the current green weekly candlestick holds promise, the $67,000 to $69,000 zone will be something to watch. If BTC manages to overcome this area and flip it into a support zone, the bull run theory will become a high-probability scenario.
The Relative Strength Index (RSI) is attempting to bounce from just below the overbought zone, showing no real signs of a bullish comeback. The lagging Awesome Oscillator (AO) is still indicating the bullish momentum is on the decline and also has not shown a buyer comeback yet.
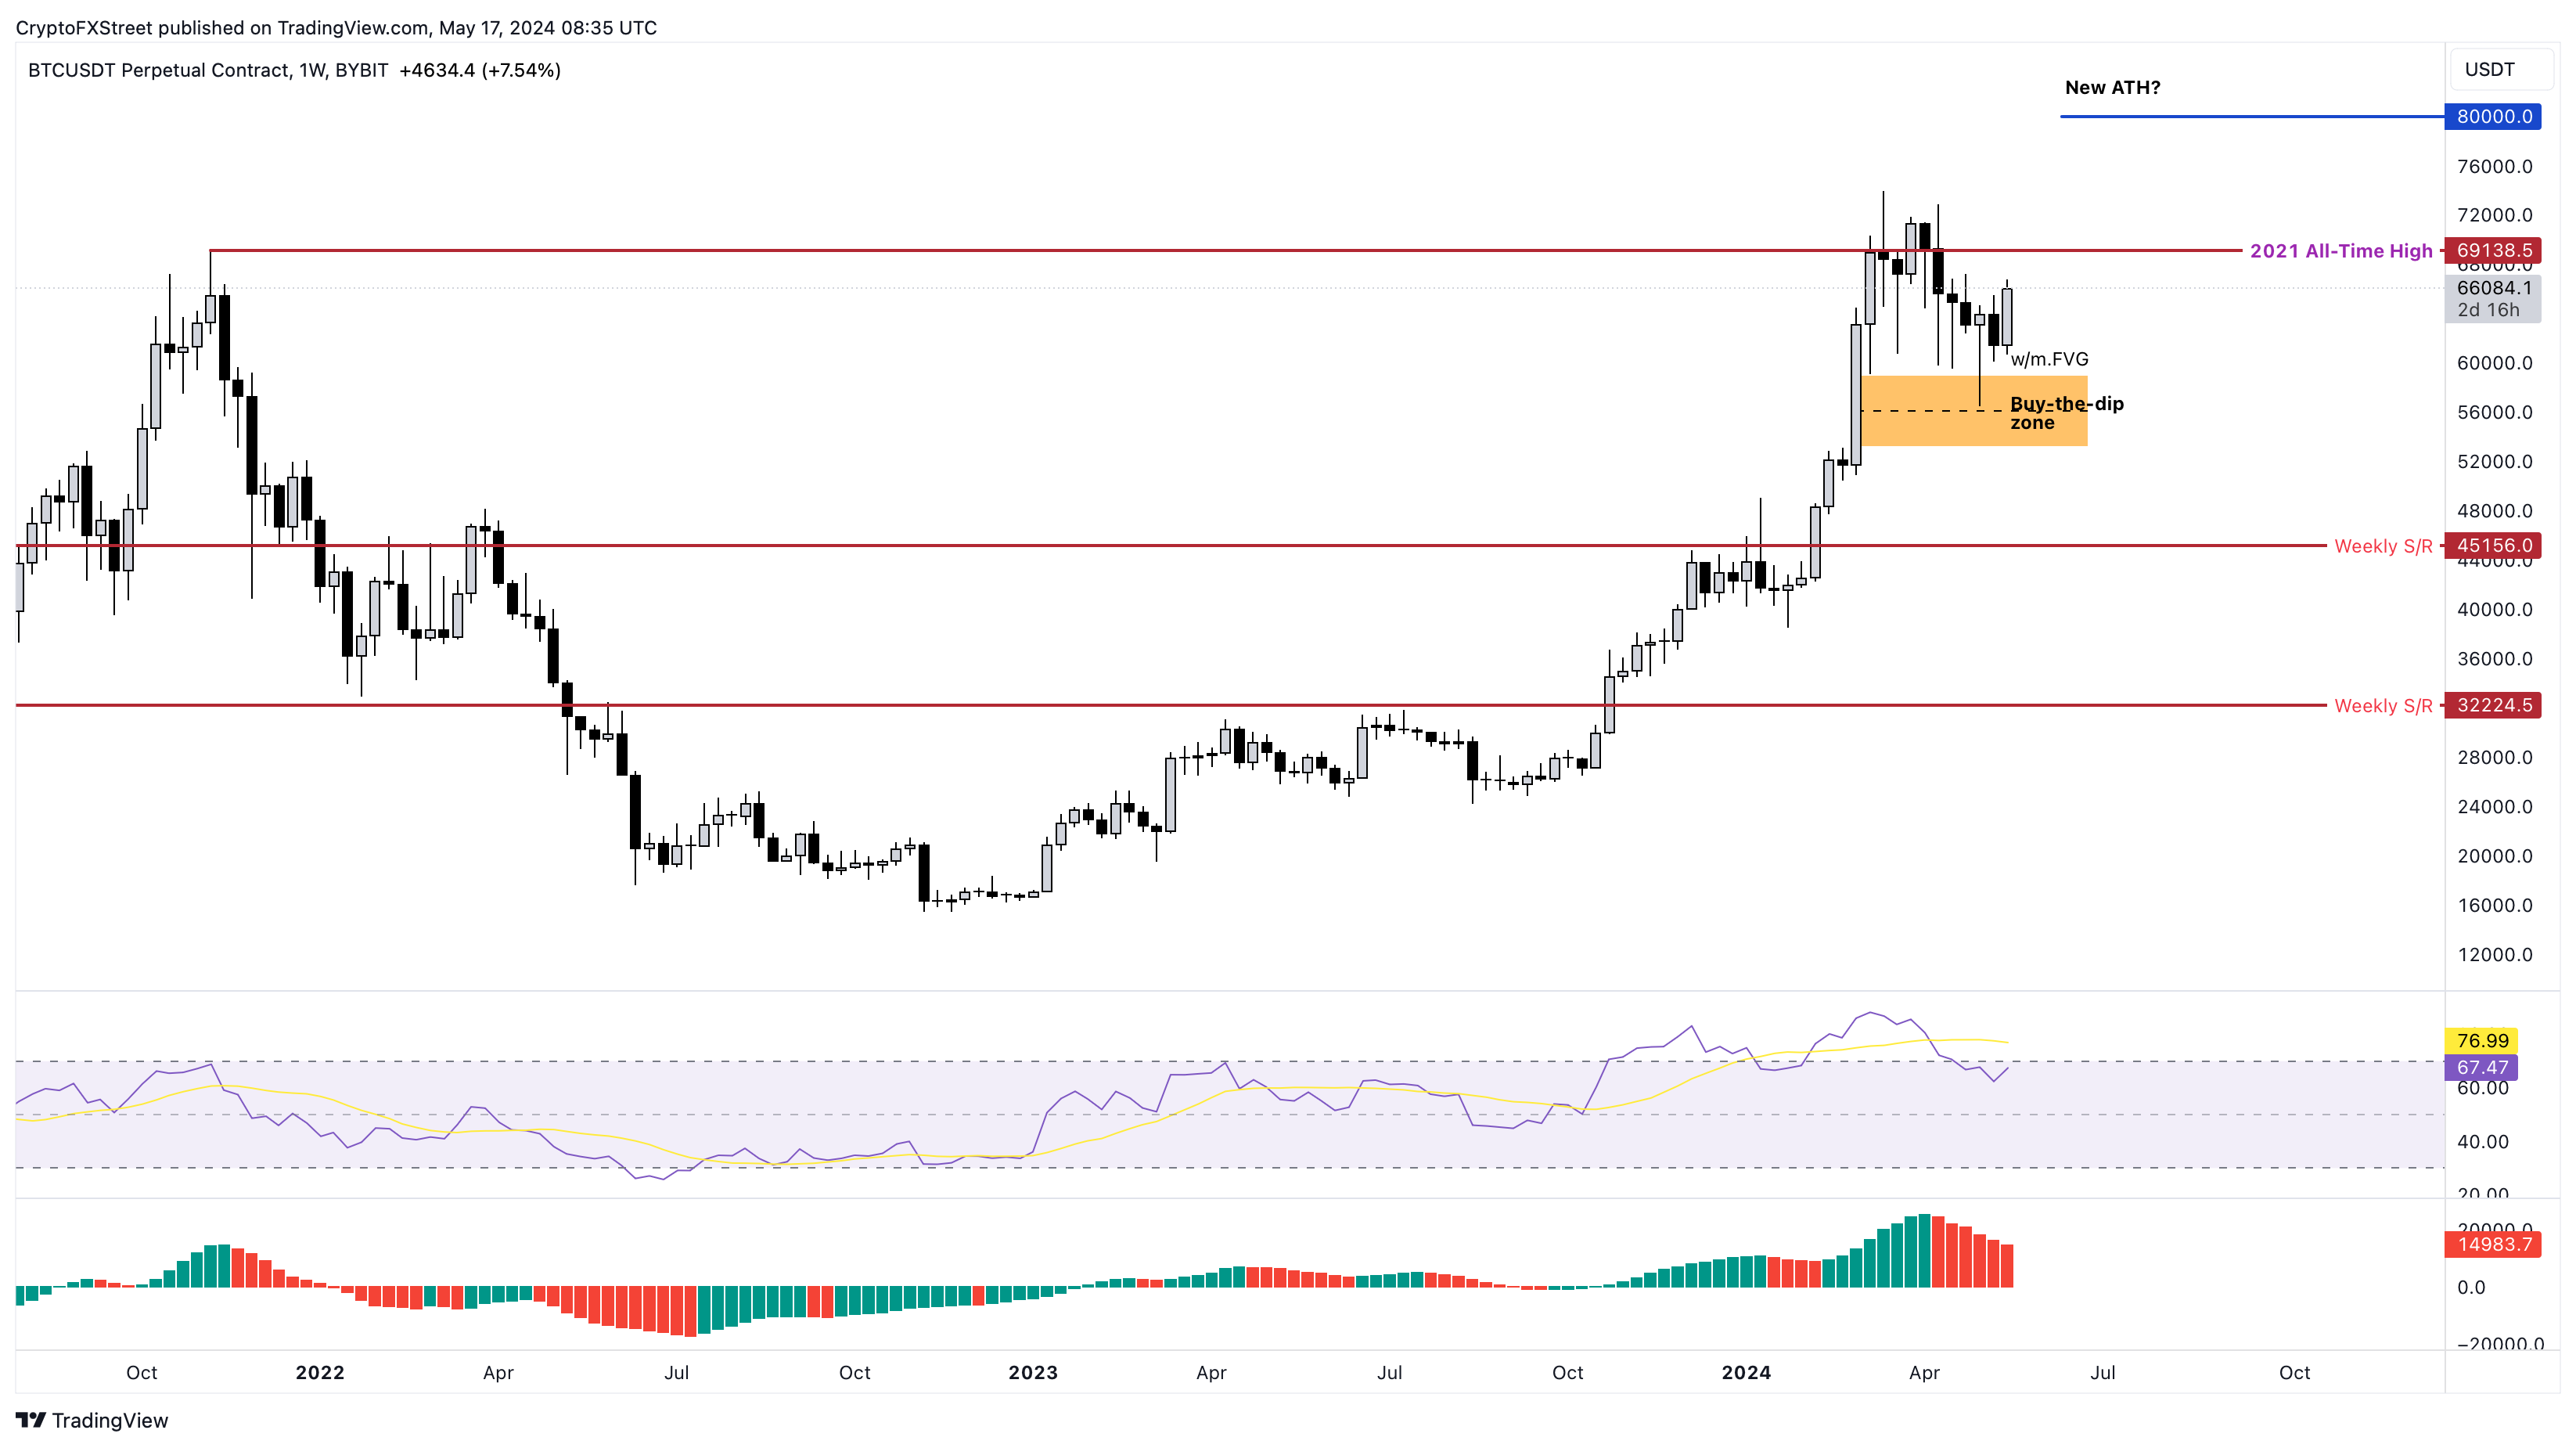
BTC/USDT 1-week chart
The daily chart for Bitcoin shows a much more nuanced outlook as compared to the weekly. On this lower time frame, BTC shows a possibility of a dip into the $64,580 to $63,095 imbalance zone, which could be a good accumulation zone.
But the bias is bullish on the daily chart and shows that an upthrust to $70,000 psychological level is likely in the coming weeks. The RSI supports this outlook after its recent flip of the 50 mean level, showcasing the takeover of bulls in the recent past. The AO also hints at a surge in bullish momentum after the recent print of the histogram above the zero mean level.
All in all, the daily chart for Bitcoin price shows a clear bullish outlook and that BTC is likely headed to $70,000.
Still, – and to answer the question posed in the title of this article – Bitcoin price is not out of the woods yet. Although the outlook for BTC is bullish, it needs to flip the declining trend line connecting the lower highs formed since the all-time high (ATH) of $73,949 and the horizontal hurdle at $70,000. Once these barriers are overcome, Bitcoin price will be out of the woods and ready to resume the uptrend. In such a case, BTC could attempt to set a new ATH at $80,000.
BTC/USDT 1-day chart
Read more: Week Ahead: Crypto market eyes a bullish turnaround
Gauging BTC’s health using on-chain metrics
According to Santiment, the number of Active Addresses interacting with the Bitcoin blockchain has shot up from 600K to 710K in the last four days.
BTC Active Addresses
The number of BTC held on exchanges has also dropped from 810K to 788K, a 2.7% fall in just two days. This decline shows that investors are confident in Bitcoin price performance and are not looking to sell, which could be one reason why they have taken their holdings off centralized platforms.
BTC Supply on Exchanges
Adding credence to the aforementioned outlook is CryptoQuant’s Realized Price by Address Cohorts metric. This metric tracks “new whales”, meaning addresses that have accumulated more than 1,000 BTC in less than six months. The chart shows that these new whales have been accumulating Bitcoin around the $60,000 psychological level. These addresses now hold nearly 1.5 million BTC. In contrast, the old whale addresses holding more than 1,000 BTC for over six months show a stable realized price of roughly $20,000.
BTC Realized Price by Address Cohorts
With on-chain metrics showcasing a bullish opportunity for Bitcoin and technicals indicating a cautiously optimistic outlook, investors need to be careful when deciding whether to start accumulating at the current price level or wait for a better entry.
Diverging industry comments
QCP Capital, a Singapore-based crypto-asset trading firm, noted in their recent post that the recent breakout in Bitcoin price and other risk assets was due to the US Consumer Price Index (CPI), which declined to 3.4% in April. The investment and trading firm expects this momentum to carry BTC to $74,000.
Read more: Bitcoin likely to return to all-time high of $73,949, QCP Capital says
According to a report published on Thursday by JP Morgan analysts, the current cost of Bitcoin production hovers roughly between $45,000 and $42,000. Additionally, the lack of Bitcoin ETF inflows coupled with a sparse interest in BTC ETF products in Hong Kong suggests that Bitcoin's upside in the medium term is limited.
- Bitcoin price shows signs of continuing its uptrend, providing a buying opportunity between $64,580 to $63,095.
- On-chain metrics forecast a bullish outlook for BTC ahead.
- If BTC clears $70,000, the chances of resuming the uptrend would skyrocket.
Bitcoin (BTC) price action in the past two days has confirmed the resumption of the bull run. However, BTC needs to clear a few key hurdles before investors can go all-in.
Also read: Is the crypto bull run back?
Bitcoin price top-down analysis
Looking at the weekly chart, it looks like Bitcoin price could go either way. While the current green weekly candlestick holds promise, the $67,000 to $69,000 zone will be something to watch. If BTC manages to overcome this area and flip it into a support zone, the bull run theory will become a high-probability scenario.
The Relative Strength Index (RSI) is attempting to bounce from just below the overbought zone, showing no real signs of a bullish comeback. The lagging Awesome Oscillator (AO) is still indicating the bullish momentum is on the decline and also has not shown a buyer comeback yet.
BTC/USDT 1-week chart
The daily chart for Bitcoin shows a much more nuanced outlook as compared to the weekly. On this lower time frame, BTC shows a possibility of a dip into the $64,580 to $63,095 imbalance zone, which could be a good accumulation zone.
But the bias is bullish on the daily chart and shows that an upthrust to $70,000 psychological level is likely in the coming weeks. The RSI supports this outlook after its recent flip of the 50 mean level, showcasing the takeover of bulls in the recent past. The AO also hints at a surge in bullish momentum after the recent print of the histogram above the zero mean level.
All in all, the daily chart for Bitcoin price shows a clear bullish outlook and that BTC is likely headed to $70,000.
Still, – and to answer the question posed in the title of this article – Bitcoin price is not out of the woods yet. Although the outlook for BTC is bullish, it needs to flip the declining trend line connecting the lower highs formed since the all-time high (ATH) of $73,949 and the horizontal hurdle at $70,000. Once these barriers are overcome, Bitcoin price will be out of the woods and ready to resume the uptrend. In such a case, BTC could attempt to set a new ATH at $80,000.
BTC/USDT 1-day chart
Read more: Week Ahead: Crypto market eyes a bullish turnaround
Gauging BTC’s health using on-chain metrics
According to Santiment, the number of Active Addresses interacting with the Bitcoin blockchain has shot up from 600K to 710K in the last four days.
BTC Active Addresses
The number of BTC held on exchanges has also dropped from 810K to 788K, a 2.7% fall in just two days. This decline shows that investors are confident in Bitcoin price performance and are not looking to sell, which could be one reason why they have taken their holdings off centralized platforms.
BTC Supply on Exchanges
Adding credence to the aforementioned outlook is CryptoQuant’s Realized Price by Address Cohorts metric. This metric tracks “new whales”, meaning addresses that have accumulated more than 1,000 BTC in less than six months. The chart shows that these new whales have been accumulating Bitcoin around the $60,000 psychological level. These addresses now hold nearly 1.5 million BTC. In contrast, the old whale addresses holding more than 1,000 BTC for over six months show a stable realized price of roughly $20,000.
BTC Realized Price by Address Cohorts
With on-chain metrics showcasing a bullish opportunity for Bitcoin and technicals indicating a cautiously optimistic outlook, investors need to be careful when deciding whether to start accumulating at the current price level or wait for a better entry.
Diverging industry comments
QCP Capital, a Singapore-based crypto-asset trading firm, noted in their recent post that the recent breakout in Bitcoin price and other risk assets was due to the US Consumer Price Index (CPI), which declined to 3.4% in April. The investment and trading firm expects this momentum to carry BTC to $74,000.
Read more: Bitcoin likely to return to all-time high of $73,949, QCP Capital says
According to a report published on Thursday by JP Morgan analysts, the current cost of Bitcoin production hovers roughly between $45,000 and $42,000. Additionally, the lack of Bitcoin ETF inflows coupled with a sparse interest in BTC ETF products in Hong Kong suggests that Bitcoin's upside in the medium term is limited.
Information on these pages contains forward-looking statements that involve risks and uncertainties. Markets and instruments profiled on this page are for informational purposes only and should not in any way come across as a recommendation to buy or sell in these assets. You should do your own thorough research before making any investment decisions. FXStreet does not in any way guarantee that this information is free from mistakes, errors, or material misstatements. It also does not guarantee that this information is of a timely nature. Investing in Open Markets involves a great deal of risk, including the loss of all or a portion of your investment, as well as emotional distress. All risks, losses and costs associated with investing, including total loss of principal, are your responsibility. The views and opinions expressed in this article are those of the authors and do not necessarily reflect the official policy or position of FXStreet nor its advertisers.