Bitcoin price volatility alarmingly low, $16,500 is key liquidation level for BTC
|
- Bitcoin long and short positions see parity after BTC price volatility hits an all-time low.
- Experts believe institutional traders could hunt liquidity at the $16,500 level, based on the liquidation levels heatmap.
- BTC could gather liquidity between the $16,200 and $16,500 level before a run-up to the $18,000 target.
Bitcoin price missed out on the Santa rally as the asset’s volatility hit a historic low. The past week's events offered no push to BTC volatility without a macroeconomic trigger for the asset’s price trend.
Also read: Bitcoin prepares for spike in volatility after holding steady through US stock market bloodbath
Bitcoin price volatility hits all-time low, BTC misses the Santa rally
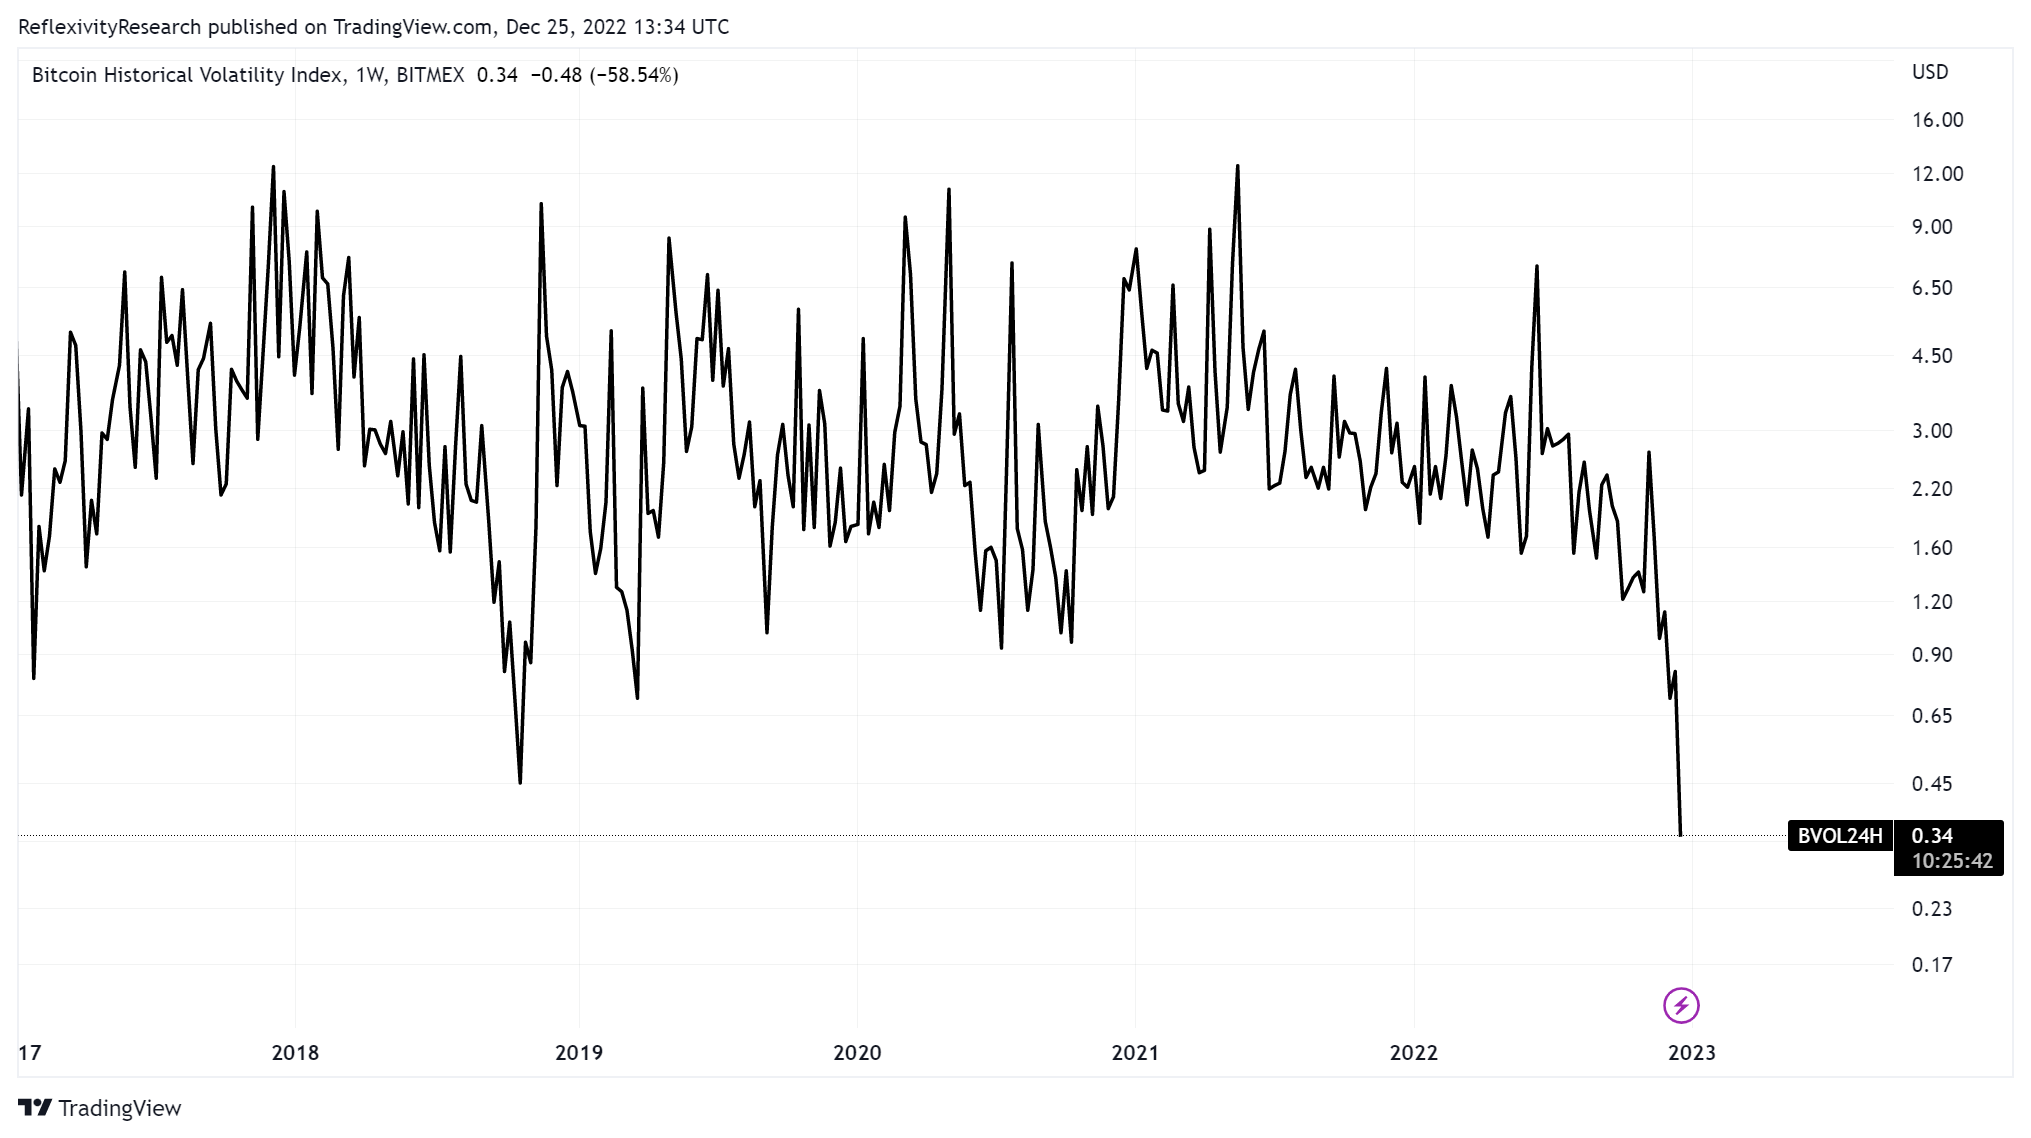
Bitcoin volatility hit an all-time low on Christmas. Periods of low volatility precede periods of explosive price moves in Bitcoin. Will Clemente, a Bitcoin analyst, shared a chart of the Bitcoin Volatility Index, highlighting BTC’s new all-time low volatility.

Bitcoin Historical Volatility Index
Experts on crypto Twitter have spotted similarities between Christmas 2018 and the 2022 cycle. Christmas 2018 marks Bitcoin's last bear market phase during its previous halving cycle. Analysts are convinced that the length of time between BTC’s prior all-time high and Christmas lows is broadly similar.
Bagsy, the analyst on crypto Twitter, believes that the most significant asset by market capitalization could fail to bounce above the $25,000 level. The asset’s recovery would primarily rely on the halving year 2024.
After BTC missed its Santa rally, the cryptocurrency prepares for its next market trough. Toni Ghinea, the crypto analyst and trader, predicted a bull trap between $17,500 and $19,000 in December 2022 before a final crash to the $11,000- $14,000 level in Q1 2023.
Could BTC collect liquidity before running up to the $18,000 level?
Based on data from Bitcoin liquidity charts, technical analyst CrypNuevo believes there is a high possibility that the $17,100 and $17,500 levels could get tagged before the end of 2023.
Liquidation Levels Heatmap
According to the Liquidation Levels Heatmap, there is $50 billion worth of liquidation between the $13,500 and $14,000 levels. If the BTC price drops to this level, cascading liquidations could increase the pressure on the asset. Analysts believe that Institutional traders will slowly increase activity in the next few days, and markets will gain some volatility.
Analysts argue that liquidity levels are essential to retail investor activity. In a downtrend, CrypNeuvo argues that traders can’t dismiss the possibility of a short-term long set up in downtrend. The expert believes scooping up BTC between $16,200 and $16,500 is the ideal trade setup before the asset targets the $18,000 level.
Information on these pages contains forward-looking statements that involve risks and uncertainties. Markets and instruments profiled on this page are for informational purposes only and should not in any way come across as a recommendation to buy or sell in these assets. You should do your own thorough research before making any investment decisions. FXStreet does not in any way guarantee that this information is free from mistakes, errors, or material misstatements. It also does not guarantee that this information is of a timely nature. Investing in Open Markets involves a great deal of risk, including the loss of all or a portion of your investment, as well as emotional distress. All risks, losses and costs associated with investing, including total loss of principal, are your responsibility. The views and opinions expressed in this article are those of the authors and do not necessarily reflect the official policy or position of FXStreet nor its advertisers.