Bitcoin price shows ambiguity as a 30% move is underway according to technicals
|
- Bitcoin price has been trading sideways in a tightening range since January 8.
- The digital asset awaits a clear breakout or breakdown as the range continues to squeeze.
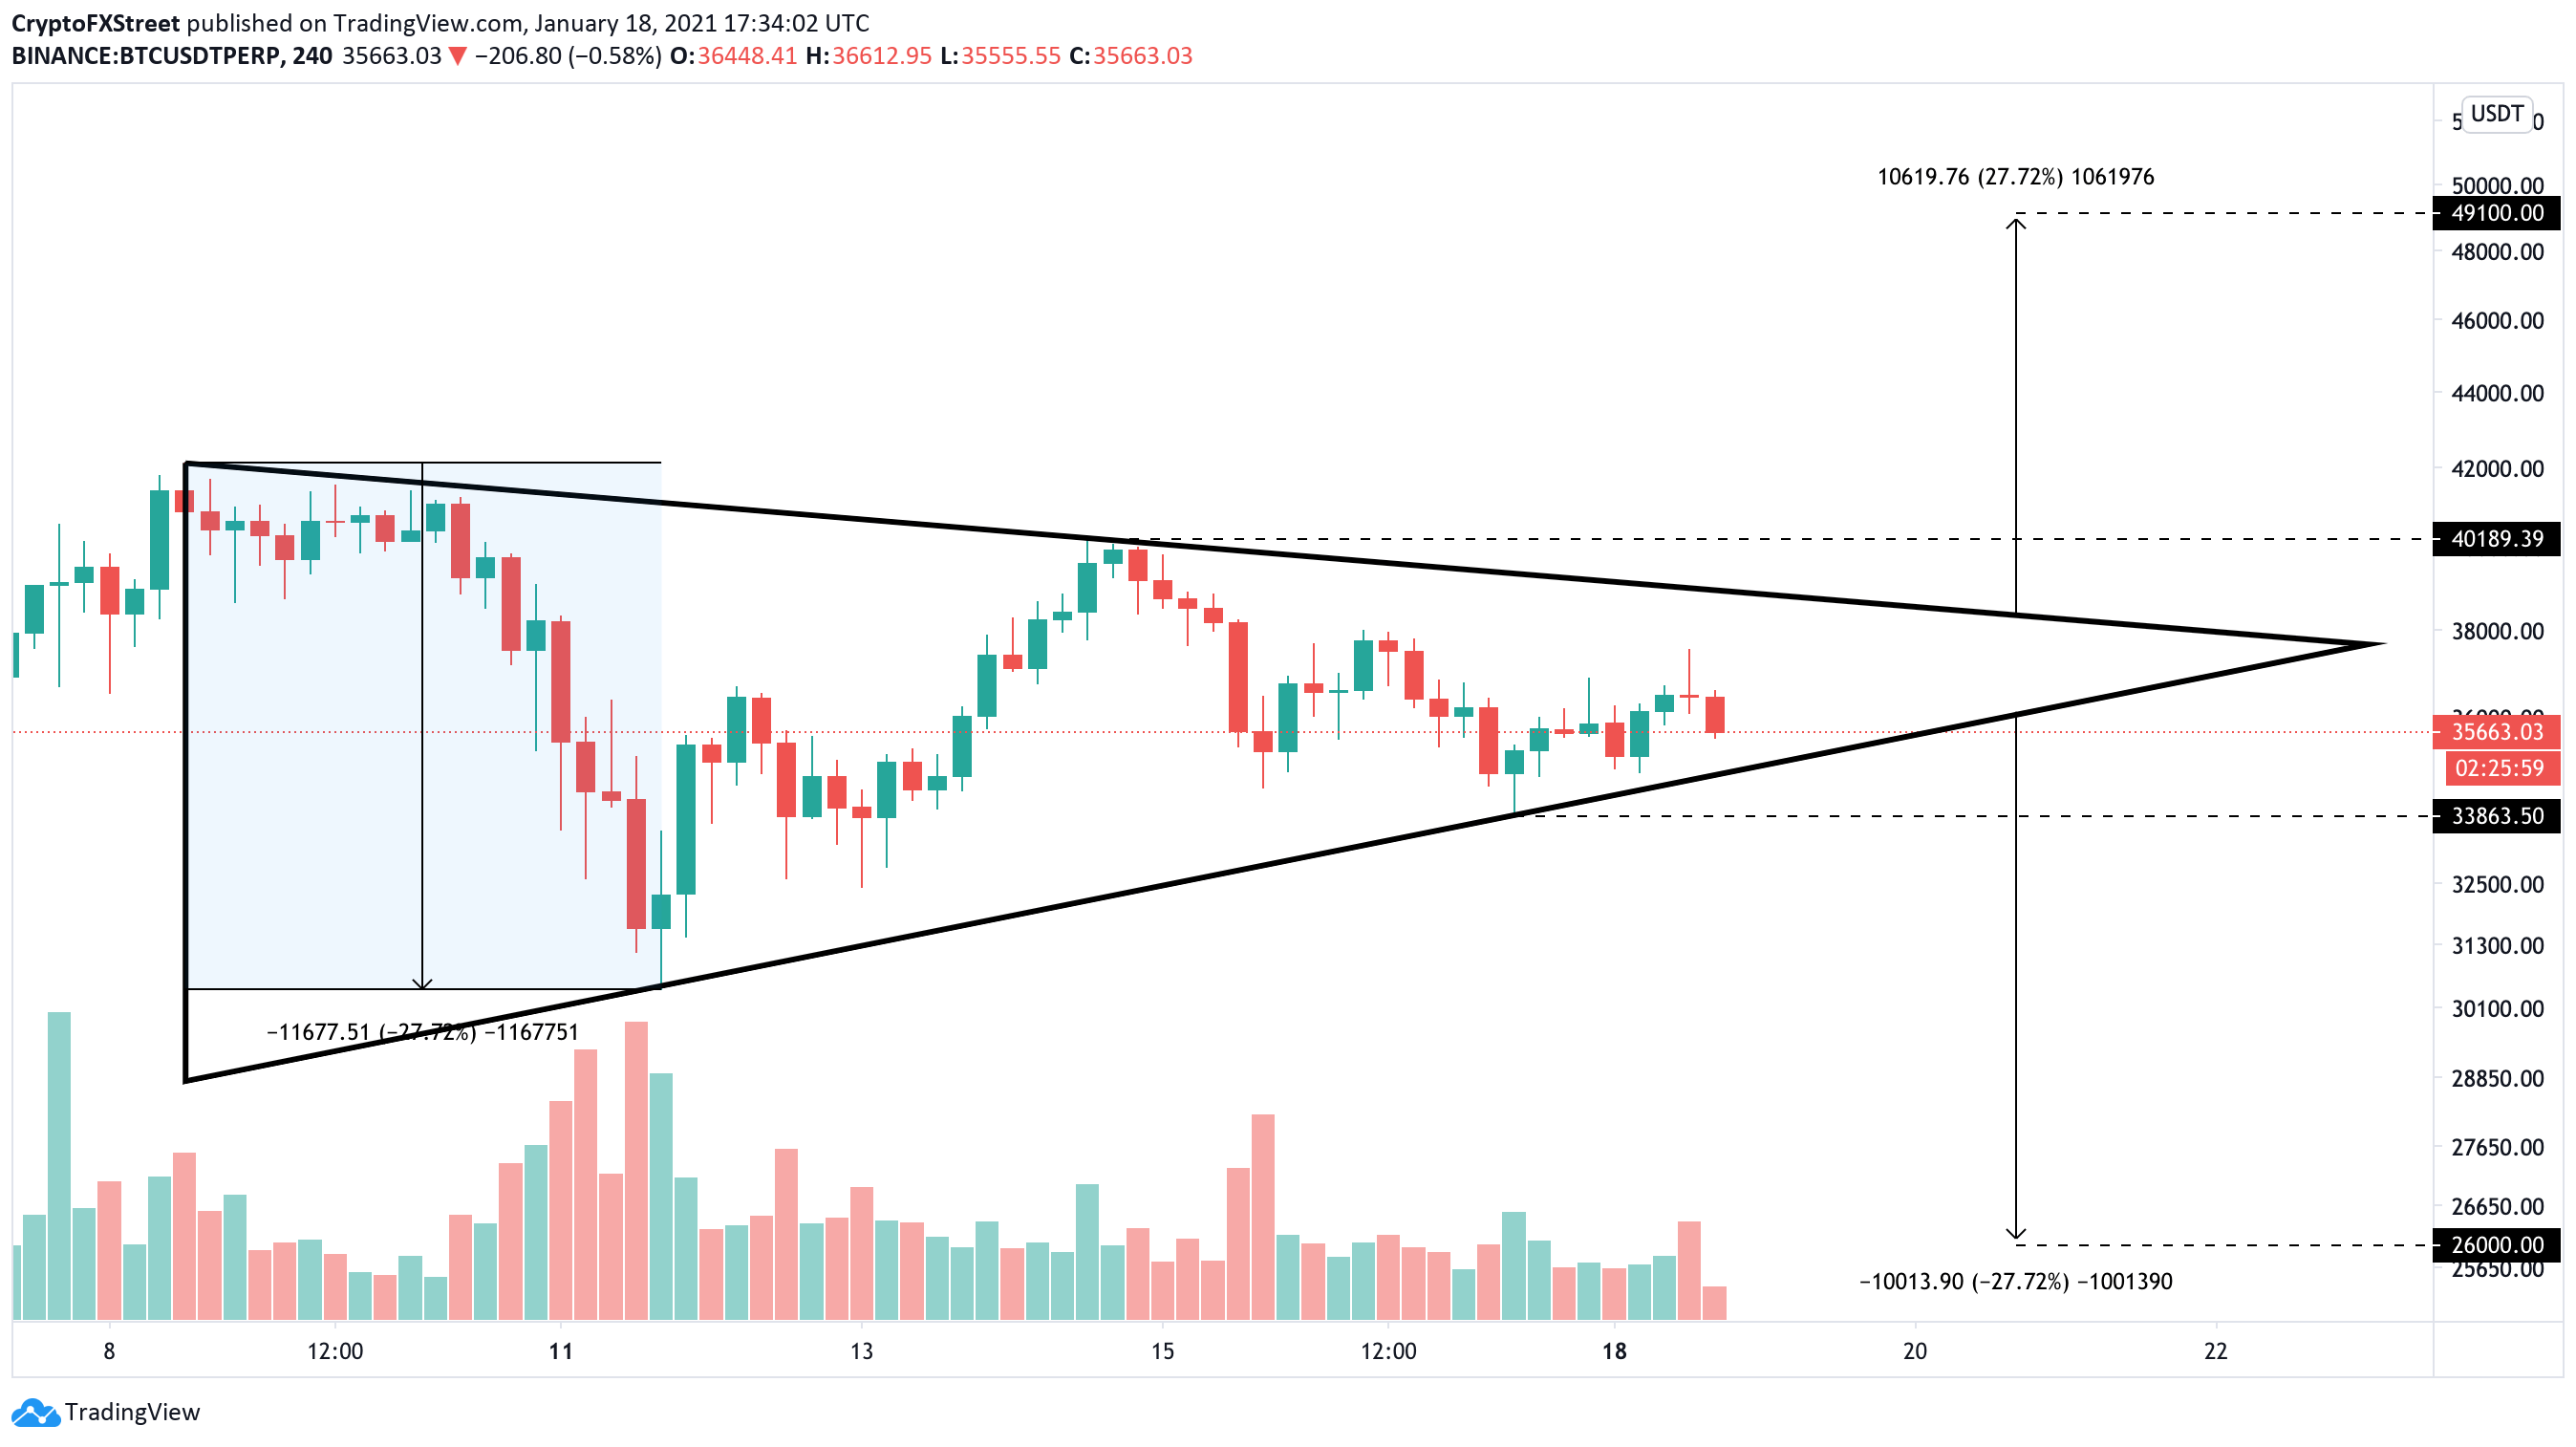
Bitcoin has been trading inside a tight range after establishing a new all-time high at $41,950. The digital asset plummeted down to $30,420 and then formed a lower high at $40,100 followed by what seems to be a higher low at $33,850.
Bitcoin price on the verge of a massive move
Bitcoin price has established a symmetrical triangle pattern on the 4-hour chart and awaits a clear breakout or breakdown. As the overall trend is bullish, a breakout seems more likely and could quickly take Bitcoin price up to $50,000.
Trading veteran Peter Brandt seems to support this idea stating:
A 2-week symmetrical triangle is forming. A decline back toward 32,000 could nicely establish a low upon which the market will stabilize. If 32,000 does not hold, then more complicated correction -- even a 30%-plus -- correction could unfold. For now I remain 80% committed to the long side of BTC. The Factor Weekly Chart and Factor Weekly and Daily Trend Models remain up. No top pattern has formed.
BTC/USD 4-hour chart
The number of Bitcoin inside exchanges has continued to drop since reaching 10.56% on January 4 as it currently sits around 10.3% which indicates that investors are not interested in selling the digital asset.
BTC inside exchanges
Similarly, the number of whales has grown since the beginning of 2021 despite Bitcoin’s wild fluctuations in value. This metric also indicates that large investors have continued to accumulate more BTC as they expect its price to increase further.
BTC Holders Distribution
Despite all the bullish on-chain metrics, it’s entirely possible for Bitcoin price to drop below the crucial support level at $33,863 and target a low of $26,000.
BTC IOMAP chart
The In/Out of the Money Around Price (IOMAP) chart indicates that losing an essential support area between $35,000 and $36,000 could definitely push Bitcoin price down to $33,863 and lower as the support on the way down is weak.
Information on these pages contains forward-looking statements that involve risks and uncertainties. Markets and instruments profiled on this page are for informational purposes only and should not in any way come across as a recommendation to buy or sell in these assets. You should do your own thorough research before making any investment decisions. FXStreet does not in any way guarantee that this information is free from mistakes, errors, or material misstatements. It also does not guarantee that this information is of a timely nature. Investing in Open Markets involves a great deal of risk, including the loss of all or a portion of your investment, as well as emotional distress. All risks, losses and costs associated with investing, including total loss of principal, are your responsibility. The views and opinions expressed in this article are those of the authors and do not necessarily reflect the official policy or position of FXStreet nor its advertisers.
