Bitcoin Price Prediction: BTC/USD eyes further losses below $50,000
|
- Bitcoin wavers in a range above $45,000, keeps monthly support line breakdown while trying to defend 21-day SMA.
- Downward sloping RSI, receding MACD strength join sustained trading below short-term support line, now resistance to favor sellers.
- 50-day SMA, ascending trend line from December 11 favor will offer strong support.
- Bulls should wait for successful run-up past-$50,000 for fresh entry.
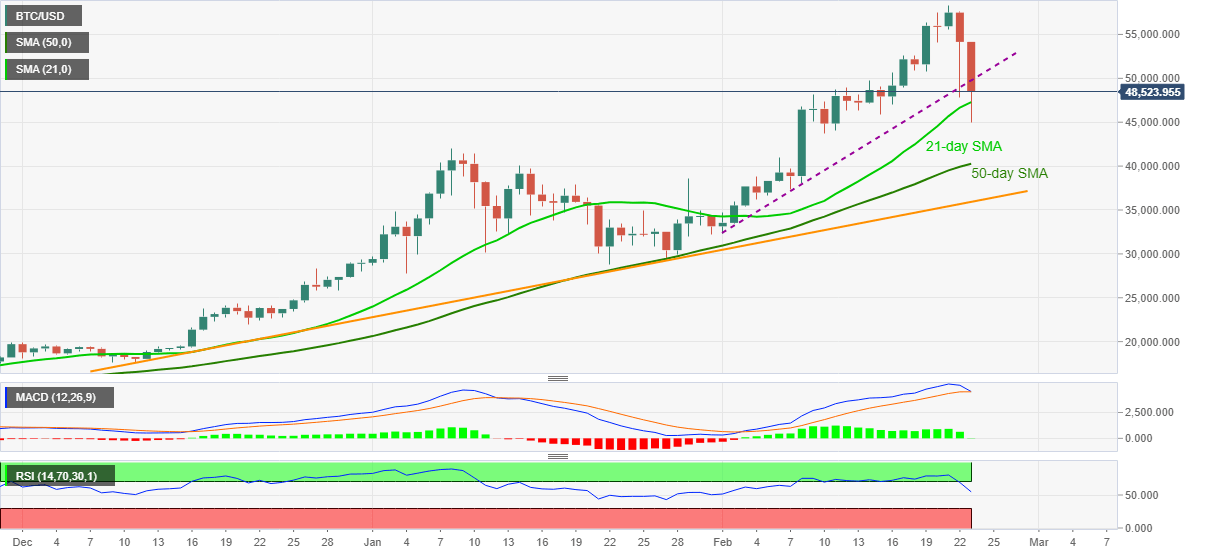
Bitcoin bulls lick their wounds below $50,000, currently around $48,400 while trying to tame the downside break of a short-term key support line, now resistance, during early Wednesday.
In doing so, the quote tries to justify its bounce-off 21-day SMA but the downward sloping RSI line and receding strength of the MACD signals suggest further challenges for the crypto optimists.
As a result, a clear break below the 21-day SMA level of $47,290 will direct short-term BTC/USD sellers toward 50-day SMA, currently around $40,250. However, any further weakness will be tamed by a 10-week-old support line, at $35,900.
In a case where the crypto major fails to bounce off the key support line, odds of its drop to the monthly low near $32,000 can’t be ruled out.
Alternatively, corrective pullback beyond the previous support line, at $49,700 now, will have to cross the $50,000 hurdle to recall the BTC/USD buyers.
Following that the latest high of $58,355 can offer an intermediate halt ahead of directing the run-up to the $60,000 round-figure.
To sum up, Bitcoin’s latest pullback is likely to extend but the bulls aren’t out of the woods.
BTC/USD daily chart
Trend: Further weakness expected
Information on these pages contains forward-looking statements that involve risks and uncertainties. Markets and instruments profiled on this page are for informational purposes only and should not in any way come across as a recommendation to buy or sell in these assets. You should do your own thorough research before making any investment decisions. FXStreet does not in any way guarantee that this information is free from mistakes, errors, or material misstatements. It also does not guarantee that this information is of a timely nature. Investing in Open Markets involves a great deal of risk, including the loss of all or a portion of your investment, as well as emotional distress. All risks, losses and costs associated with investing, including total loss of principal, are your responsibility. The views and opinions expressed in this article are those of the authors and do not necessarily reflect the official policy or position of FXStreet nor its advertisers.