Bitcoin Price Prediction: BTC bulls target $54,500 next
|
- BTC/USD bulls catch a breather around record top, keeps upside break of six-week-old resistance marked Wednesday.
- Bullish MACD, sustained trading above 10-day SMA, FE 61.8% also favor the buyers.
- Early January top restricts bear’s entry, $55,000 adds to the upside filter.
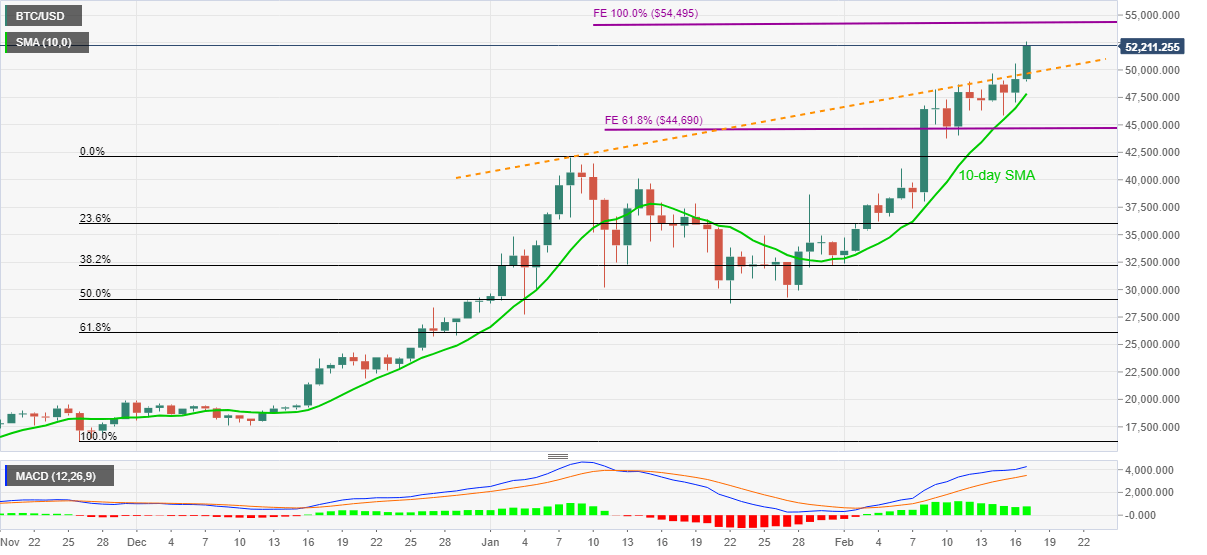
Bitcoin remains on the front foot despite the latest dribbling around the record top of $52.638 during early Thursday. In doing so, the BTC/USD pair keeps the previous day’s upside break of short-term key resistance line while extending run-up beyond 61.8% Fibonacci Expansion (FE) of November 26, 2020, to January 08, 2021, upside and the following pullback to $28,768 on January 22, 2021.
Also favoring the cryptocurrency buyers is the quote’s successful run-up beyond 10-day SMA amid the bullish MACD.
As a result, the BTC/USD prices are well directed towards the next FE resistance level of 100% around $54,500 ahead of targeting the $55,000 round-figure.
Meanwhile, the $50,000 psychological magnet precedes the previous resistance line, at $49,700, to restrict the short-term downside moves.
Even if the BTC/USD sellers dominate past-$49,700, 10-day SMA and the early January 2021 top, respectively around 47,850 and $42,000, will add filters during the further declines.
Overall, the bitcoin bull-run has a long way to go before hitting the wall wherein the $54,500 hurdle can satisfy buyers for now.
BTC/USD daily chart
Trend: Bullish
Information on these pages contains forward-looking statements that involve risks and uncertainties. Markets and instruments profiled on this page are for informational purposes only and should not in any way come across as a recommendation to buy or sell in these assets. You should do your own thorough research before making any investment decisions. FXStreet does not in any way guarantee that this information is free from mistakes, errors, or material misstatements. It also does not guarantee that this information is of a timely nature. Investing in Open Markets involves a great deal of risk, including the loss of all or a portion of your investment, as well as emotional distress. All risks, losses and costs associated with investing, including total loss of principal, are your responsibility. The views and opinions expressed in this article are those of the authors and do not necessarily reflect the official policy or position of FXStreet nor its advertisers.
