Bitcoin price could revisit $22,000 if this mean reversion play pans out
|
- Bitcoin price has been in a tight consolidative range for nearly nine days.
- A sweep of the $19,511 liquidity cluster may likely trigger a recovery to $21,874.
- A daily close that breaks below then flips $19,511 support into resistance will invalidate the bullish thesis.
Bitcoin price has been in a consolidation range for the last nine days and shows no signs of breaking lower or higher. However, the general outlook for BTC is that it needs to collect liquidity before attempting a recovery rally.
While the price action of BTC is boring without a doubt, news about a leading Bitcoin enthusiast, Michael Saylor, the CEO of MicroStrategy, is not. Saylor has hit headlines after being caught in the regulatory whirlwind as the District of Columbia files a tax fraud suit against him.
While one of the major BTC proponents gets served, Poolin miners, who form part of a Bitcoin and wider cryptocurrency mining pool, are worried as the company halts withdrawals on its wallet service, citing liquidity issues.
Bitcoin price needs to show its hand soon
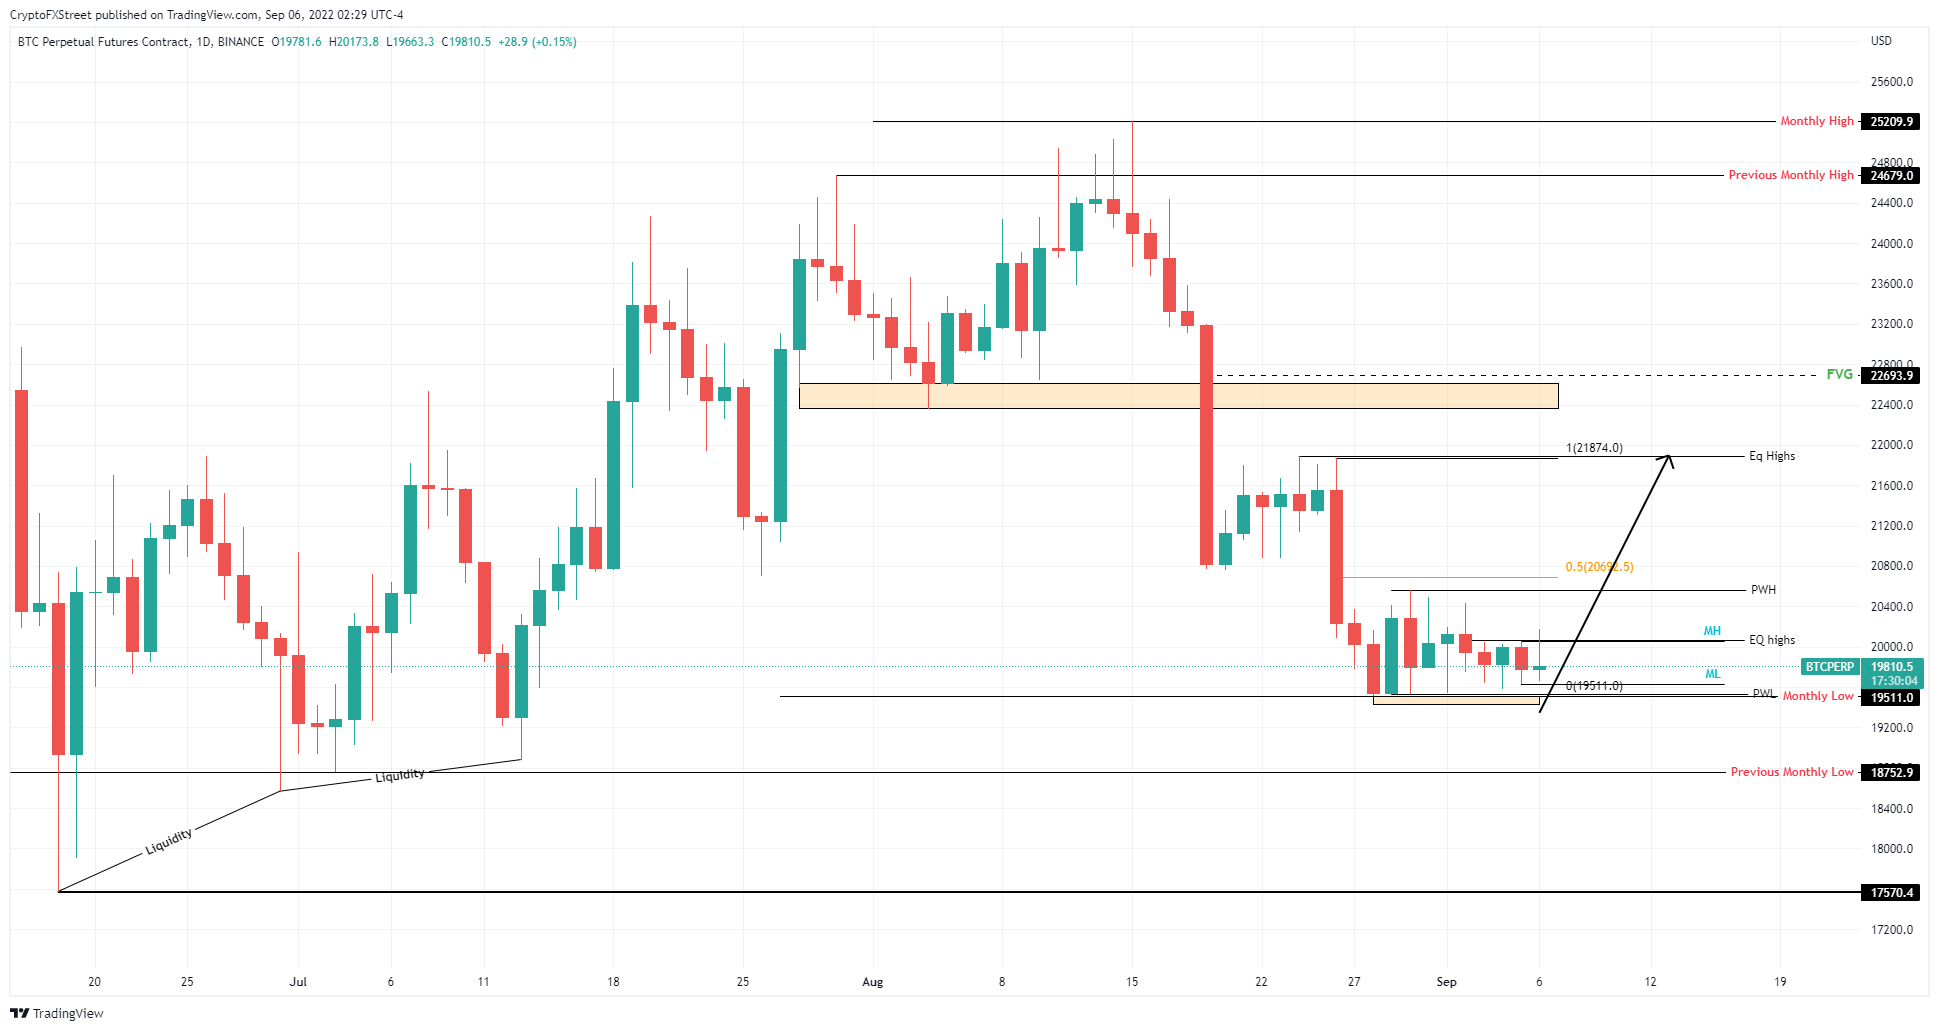
Bitcoin price has come extremely close to sweeping the $19,511 level, which contains the August month’s lows, double bottoms and last week’s lows. Hence, this coinciding cluster contains a lot of uncollected sell-stop liquidity resting below.
A sweep of the $19,511 level could be followed by a quick recovery above it and this would provide the initial signal required for investors to flip bullish on the recovery rally.
One of the reasons why Bitcoin price will likely attempt a recovery rally here is “mean reversion” ie., after a massive move in one direction, the asset reverses and revisits the mean of the recent move to close the efficiency gap.
With that in mind, a sweep of $19,511 could result in a retest of $20,692, which is the midpoint of the 10% crash seen between August 26 and August 28. In some cases, Bitcoin price might also revisit the range high at $21,874 to collect the buy-stop liquidity resting above the equal highs, bringing the total gain to 12%.
BTC/USDT 1-day chart
While things are looking up for Bitcoin price, a breakdown of the $19,511 support level will invalidate the bullish thesis. This development could see BTC revisit the swing lows formed on July 13 at $18,880 and or the previous month’s low at $18,752.
In a highly bearish case, Bitcoin price could revisit the $17,570 support level.
Information on these pages contains forward-looking statements that involve risks and uncertainties. Markets and instruments profiled on this page are for informational purposes only and should not in any way come across as a recommendation to buy or sell in these assets. You should do your own thorough research before making any investment decisions. FXStreet does not in any way guarantee that this information is free from mistakes, errors, or material misstatements. It also does not guarantee that this information is of a timely nature. Investing in Open Markets involves a great deal of risk, including the loss of all or a portion of your investment, as well as emotional distress. All risks, losses and costs associated with investing, including total loss of principal, are your responsibility. The views and opinions expressed in this article are those of the authors and do not necessarily reflect the official policy or position of FXStreet nor its advertisers.

