Bitcoin Price Analysis: BTC/USD runs out of steam as it nears the $9,500 level
|
- BTC/USD recovery begin to falter ahead of key resistance level.
- The Elliott Oscillator has had five straight red sessions.
- The 20-day Bollinger jaw has narrowed, which indicates decreasing price volatility.
BTC/USD daily chart
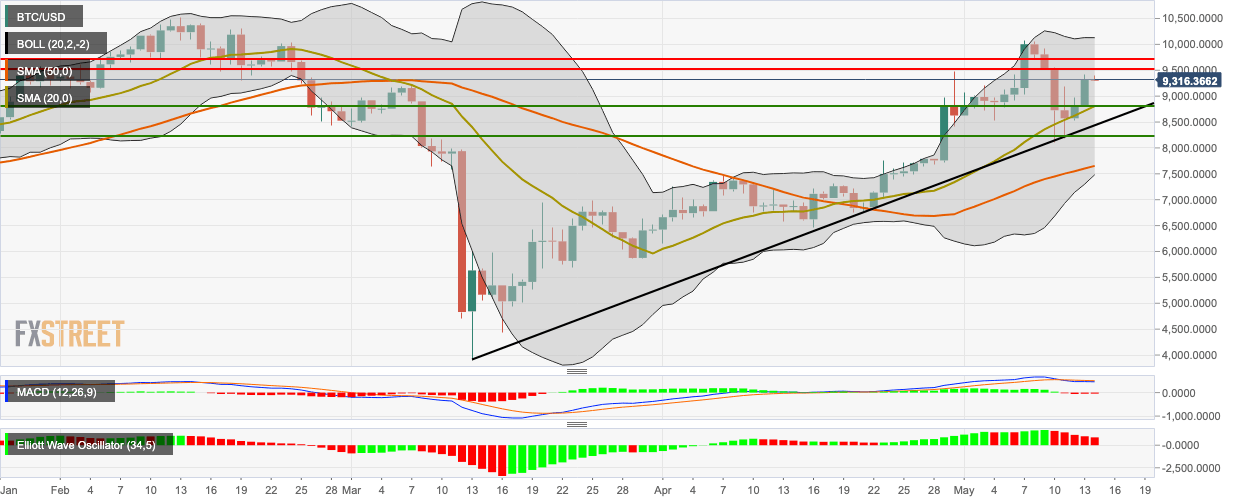
BTC/USD dropped a bit from $9,320 to $9,303 following a hugely bullish Wednesday. The Elliott Oscillator has had five straight red sessions, while the MACD shows sustained bearish momentum. The 20-day Bollinger jaw has narrowed, which indicates decreasing price volatility.
The price faces two resistance levels on the upside at $9,500 and $9,735. On the downside, there are two healthy support levels at $8,815.35 and $8,214.40.
Key levels
Information on these pages contains forward-looking statements that involve risks and uncertainties. Markets and instruments profiled on this page are for informational purposes only and should not in any way come across as a recommendation to buy or sell in these assets. You should do your own thorough research before making any investment decisions. FXStreet does not in any way guarantee that this information is free from mistakes, errors, or material misstatements. It also does not guarantee that this information is of a timely nature. Investing in Open Markets involves a great deal of risk, including the loss of all or a portion of your investment, as well as emotional distress. All risks, losses and costs associated with investing, including total loss of principal, are your responsibility. The views and opinions expressed in this article are those of the authors and do not necessarily reflect the official policy or position of FXStreet nor its advertisers.