Bitcoin Price Analysis: BTC is on the verge of an explosive movement
|
- Going by previous occurrences, Bitcoin price may be in for another period of parabolic advance if the $19,500 level is surpassed.
- Failure to front-run the newly created CME gap on the Futures market may spell trouble for Bitcoin in the short term.
Bitcoin appears to be replicating momentum akin to what it has done a couple of times from previous months. Based on these price actions, the most likely outcome may take the flagship cryptocurrency to new highs if history repeats itself.
Bitcoin's upswing lurks after fake out
The market has been going sideways for a while now as most altcoins are yet to experience any major volatility. Even Bitcoin is yet to break the hurdle of its previous highs as it trades at $18,955 at the time of writing.
This year's halving led to the beginning of a bullish wave that pushed Bitcoin's price to way past March's correction to a new all-time high of $19,915.
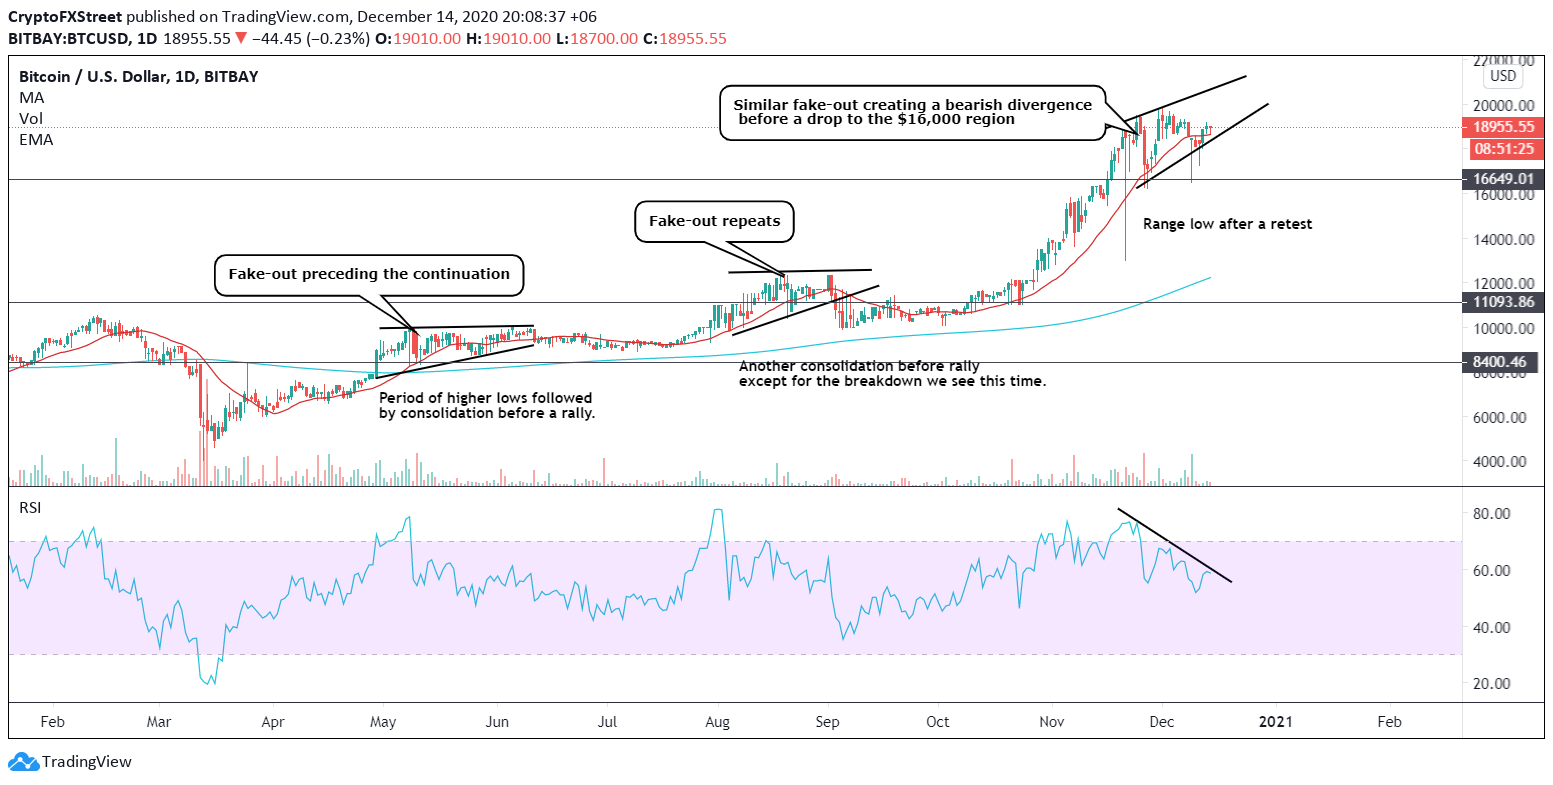
BTC/USD daily chart
Interestingly enough, ever since the uptrend began in mid-March, Bitcoin price action has been characterized by a series of higher lows with bullish divergences against the RSI along the way, followed by fake-outs. Such market behavior can also be spotted in more recent times.
The hidden bullish divergence recorded between November 26 and November 30 resulted in the construction of higher lows. Meanwhile, the tapering volume seen on the recent moves increases the odds of repetition.
The development of a rising wedge pattern may lead to a breach of the $19,500 target. Then, Bitcoin price could consolidate for a while before the next major movement. Holding above this hurdle for a prolonged period could ease the uncertainty in the cryptocurrency that results in another leg up to $21,200.
The bullish outlook may be invalidated by a break of the wedge's lower boundary. In this scenario, the next support level to look out for will be the $16,000 zone.
Bitcoin CME Futures
Another factor that could reinforce Bitcoin's bearish thesis in the short term is the setup of a new $1,000 CME gap between $18,100 and $19,100. If buying pressure does not increase, Bitcoin will make a move to refill the gap, as it has happened in the past. The drawback could further extend into filling another outstanding opening on the CME chart created back in November.
Information on these pages contains forward-looking statements that involve risks and uncertainties. Markets and instruments profiled on this page are for informational purposes only and should not in any way come across as a recommendation to buy or sell in these assets. You should do your own thorough research before making any investment decisions. FXStreet does not in any way guarantee that this information is free from mistakes, errors, or material misstatements. It also does not guarantee that this information is of a timely nature. Investing in Open Markets involves a great deal of risk, including the loss of all or a portion of your investment, as well as emotional distress. All risks, losses and costs associated with investing, including total loss of principal, are your responsibility. The views and opinions expressed in this article are those of the authors and do not necessarily reflect the official policy or position of FXStreet nor its advertisers.
