Bitcoin Price Analysis: $10K still in sight amid a descending channel breakout
|
- Bitcoin steadily rising on Sunday, a test of $10K inevitable.
- The No.1 coin buoyed by bullish technical set up.
- BTC bulls poised to end the week nearly 8% higher.
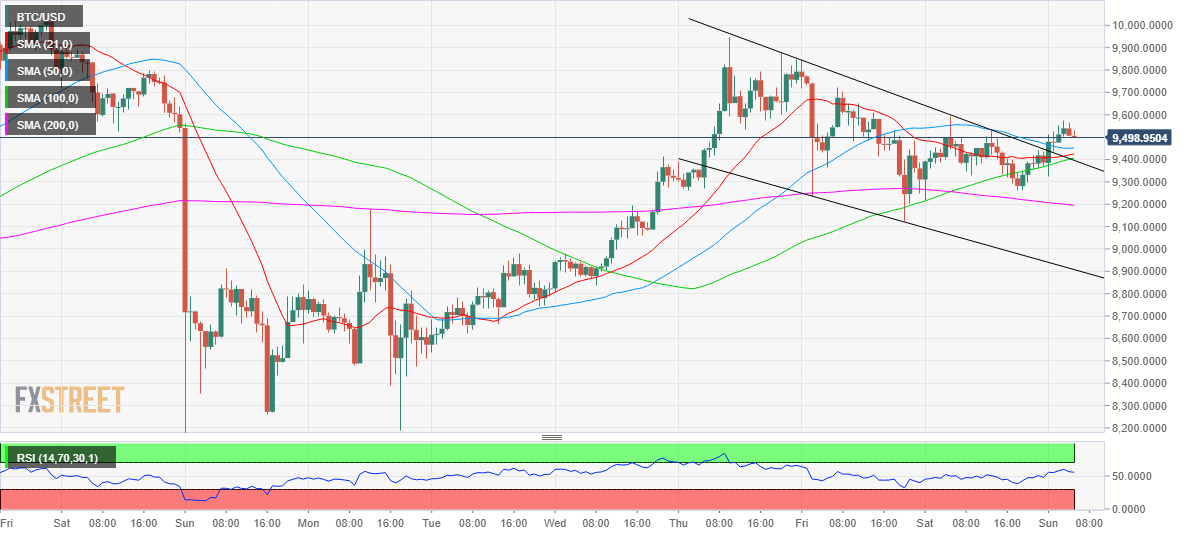
Bitcoin (BTC/USD) looks to extend the rebound from Friday’s troughs of near 9125 region into Sunday’s trading, as the weekend love prevails across the crypto market. The most widely-traded crypto asset, adds about 1.50% so far, eyeing a test of Saturday’s high of 9591.87, in the wake of a bullish near-term technical bias. The spot has entered a consolidated phase over the last hours, having faced exhaustion near 9575. At the press time, no. 1 coin trades around 9520, set to end the week 8% higher. Its market capitalization increased to $175.11 billion vs. $173.89 billion previous.
Technical Overview
BTC/USD 1-hour chart

As observed on the hourly chart, the price has charted a descending channel bullish breakout, as well anticipated here, opening doors for the pattern target at 10351. On its way towards the latter, the most favorite coin is likely to face stiff resistance at 9600 and further north at the 10000 psychological level. To add the hourly Relative Strength Index (RSI) is trending higher above the midline (50), still below the overbought territory, suggesting the further scope of upside remains in play.
The retracement from higher levels could see the immediate cushioning at 9450, the horizontal 50-Hourly Simple Moving Average (HMA). A break below the latter could see at a test of the strong demand zone around 9420-9400, where the 21, 100-HMA and descending trendline resistance-now-turned support intersect. A failure to resist above the mentioned support area could trigger a fresh sell-off towards the key 200-HMA of 9195.17.
All in all, the path of least resistance appears to the upside amid a bullish technical breakout.
BTC/USD technical levels to watch
Information on these pages contains forward-looking statements that involve risks and uncertainties. Markets and instruments profiled on this page are for informational purposes only and should not in any way come across as a recommendation to buy or sell in these assets. You should do your own thorough research before making any investment decisions. FXStreet does not in any way guarantee that this information is free from mistakes, errors, or material misstatements. It also does not guarantee that this information is of a timely nature. Investing in Open Markets involves a great deal of risk, including the loss of all or a portion of your investment, as well as emotional distress. All risks, losses and costs associated with investing, including total loss of principal, are your responsibility. The views and opinions expressed in this article are those of the authors and do not necessarily reflect the official policy or position of FXStreet nor its advertisers.