Bitcoin Elliott Wave technical analysis [Video]
|![Bitcoin Elliott Wave technical analysis [Video]](https://editorial.fxsstatic.com/images/i/BTC-bearish-animal_Small.png)
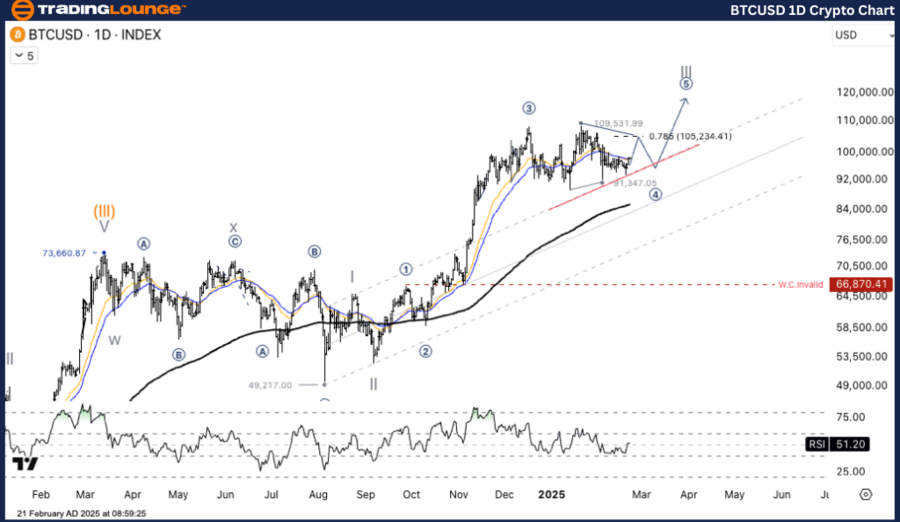
Elliott Wave Analysis TradingLounge Daily Chart.
Bitcoin/U.S. Dollar (BTCUSD).
BTC/USD Elliott Wave technical analysis
-
Function: Counter-Trend.
-
Mode: Corrective.
-
Structure: Flat.
-
Position: Wave (C).
-
Next higher degree direction: Wave ((4)).
-
Invalidation level:
Bitcoin/U.S. Dollar (BTCUSD) Trading Strategy:
BTC/USD is approaching the final phase of its Wave C correction, with key support positioned at $86,439.58. If the price rebounds and surpasses $97,198.26, it could indicate a bullish reversal. Conversely, a breakdown below $86,439.58 could signal a continuation of the downward trend.
Trading strategies:
-
Strategy:
-
Long Strategy:
-
Wait for a Buy Dip:
-
• If BTC holds above the $86,439.58 support level and shows a reversal signal, it may present a buying opportunity.
-
• The initial target is $97,198.26; if surpassed, BTC may advance towards higher resistance levels.
-
-
-
-
Risk Management:
-
If BTC/USD breaks below $86,439.58, it could extend losses toward deeper support levels in the $83,000 - $81,000 range.
-
Elliott Wave Analysis TradingLounge H4 Chart.
Bitcoin/U.S. Dollar (BTCUSD).
BTC/USD Elliott Wave technical analysis
-
Function: Counter-Trend.
-
Mode: Corrective.
-
Structure: Flat.
-
Position: Wave (C).
-
Next higher degree direction: Wave ((4)).
-
Invalidation level:
Bitcoin/U.S. Dollar (BTCUSD) Trading Strategy:
BTC/USD is nearing the completion of its Wave C correction, with strong support at $86,439.58. If the price bounces and clears $97,198.26, a bullish reversal may follow. However, if BTC falls below $86,439.58, it could indicate further downside movement.
Trading strategies:
-
Strategy:
-
Long Strategy:
-
Wait for a Buy Dip:
-
• If BTC stays above the $86,439.58 support level and provides a reversal signal, it may be a good entry point.
-
• The first target is $97,198.26; a breakout beyond this level could push BTC toward higher resistance zones.
-
-
-
-
Risk Management:
-
If BTC/USD declines below $86,439.58, it may continue falling to deeper support areas between $83,000 - $81,000.
-
TradingLounge analyst: Kittiampon Somboonsod, CEWA.
BTC/USD Elliott Wave technical analysis [Video]
Information on these pages contains forward-looking statements that involve risks and uncertainties. Markets and instruments profiled on this page are for informational purposes only and should not in any way come across as a recommendation to buy or sell in these assets. You should do your own thorough research before making any investment decisions. FXStreet does not in any way guarantee that this information is free from mistakes, errors, or material misstatements. It also does not guarantee that this information is of a timely nature. Investing in Open Markets involves a great deal of risk, including the loss of all or a portion of your investment, as well as emotional distress. All risks, losses and costs associated with investing, including total loss of principal, are your responsibility. The views and opinions expressed in this article are those of the authors and do not necessarily reflect the official policy or position of FXStreet nor its advertisers.

