Bitcoin Cash technical analysis: BCH/USD manages a hattrick of bullish days
|
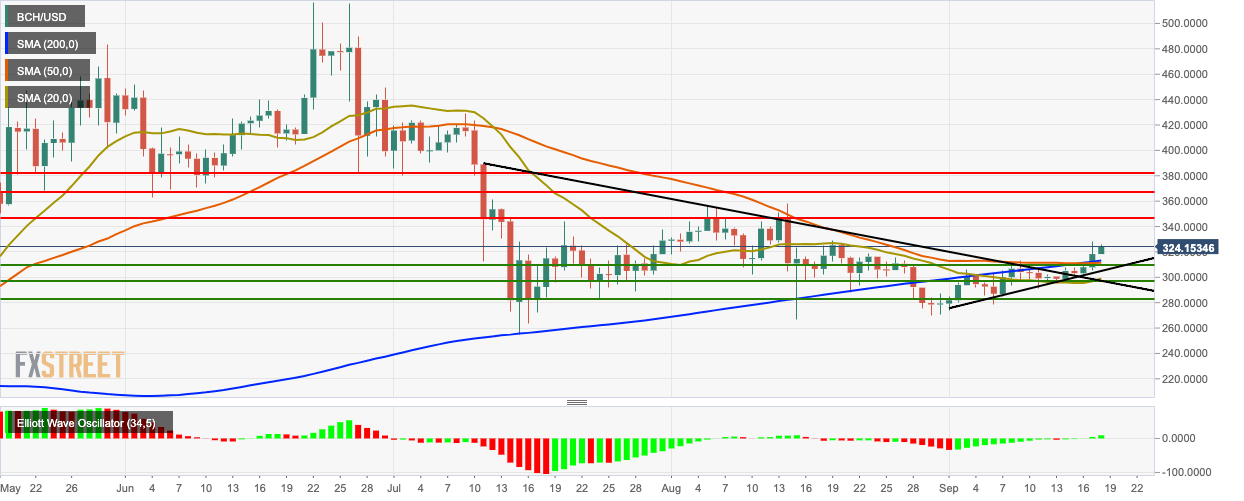
- BCH/USD went up from $318.35 to $325.30 in the early hours of Wednesday.
- The Elliott Oscillator has charted five bullish sessions in a row.
BCH/USD daily chart
BCH/USD has managed to chart three straight bullish days in a row. Bitcoin Cash has gone up from $318.35 to $325.30 today. The market had a bullish breakout from the triangle formation and is trending above the 200-day Simple Moving Average (SMA 200), SMA 50 and SMA 20 curves. The Elliott Oscillator has charted five bullish sessions in a row.
BCH/USD four-hour chart
The four-hour BCH/USD chart went up to $323.85, where it met resistance and dropped to $318.35. The bulls then re-entered the market and took the price back up to $325.30. The four-hour price is trending above the 20-day Bollinger Band, indicating that BCH/USD is currently overpriced. The Relative Strength Index (RSI) indicator has crept back into the overbought zone after exiting it.
BCH/USD hourly chart
The hourly BCH/USD has found support on the upward trending line. The hourly price is also trending above the SMA 20, SMA 50 and SMA 200 curves. The Moving Average Convergence/Divergence (MACD) line was about to cross over the signal line before they both diverged and started trending parallelly to each other.
Key Levels
Information on these pages contains forward-looking statements that involve risks and uncertainties. Markets and instruments profiled on this page are for informational purposes only and should not in any way come across as a recommendation to buy or sell in these assets. You should do your own thorough research before making any investment decisions. FXStreet does not in any way guarantee that this information is free from mistakes, errors, or material misstatements. It also does not guarantee that this information is of a timely nature. Investing in Open Markets involves a great deal of risk, including the loss of all or a portion of your investment, as well as emotional distress. All risks, losses and costs associated with investing, including total loss of principal, are your responsibility. The views and opinions expressed in this article are those of the authors and do not necessarily reflect the official policy or position of FXStreet nor its advertisers.

-637043698416994741.png)