Bitcoin bounces at $36.6K as meta adds 20% losses to US tech stock rout
|
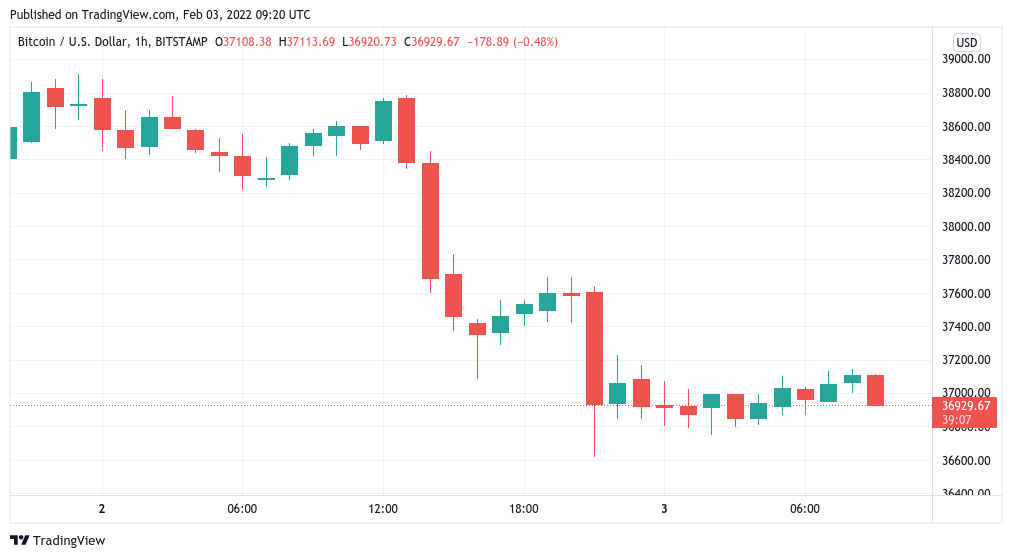
Bitcoin (BTC) recovered above $37,000 on Feb. 3 after a stocks rout took the wind out of bulls' latest attempt to crack $40,000 resistance.
BTC/USD 1-hour candle chart (Bitstamp). Source: TradingView
"Extraordinary moves" for stocks
Data from Cointelegraph Markets Pro and TradingView showed BTC/USD staying lower after briefly hitting $36,650 on Bitstamp Wednesday.
The weakness followed shock losses for U.S. equities at the Wall Street open on Wednesday, with major names such as PayPal shedding huge portions of their value after underwhelming performance reports.
Meta then followed in the after hours, hemorrhaging 20% of its share price in the wake of data showing it had begun losing users for the first time.
While Bitcoin proponents were quick to poke fun at the events, frustrating price action meant that the area identified as a key resistance/support flip looked all the less likely to break.
"If Bitcoin loses this level at $37Kish, I think it will start to drop fast towards the lower bound of the region around $34-35K," Cointelegraph contributor Michaël van de Poppe said overnight.
Van de Poppe added that going forward, the strength of the U.S. dollar could be key to understanding the coming moves for crypto markets as a whole. The U.S. dollar currency index (DXY), with which crypto is traditionally inversely correlated, lost big in recent days.
"It's really dependent on the DXY on what we're going to see on the crypto markets," he told Twitter followers.
"If the DXY is reversing in the coming weeks towards a downwards trend, that should be a huge accelerator for upwards momentum for Bitcoin."
U.S. dollar currency index (DXY) 1-day candle chart. Source: TradingView
Altcoins catch up to Bitcoin's losses
Altcoins meanwhile extended their losses on the day, with the top ten cryptocurrencies led by Solana (SOL), down nearly 10%.
A host of issues for the platform had contributed to downward price pressure, with SOL/USD trading under $100 at the time of writing.
SOL/USD 1-hour candle chart (FTX). Source: TradingView
Other weak performers were Polkadot (DOT) and Terra (LUNA), while Ether (ETH) was down 3.4% on the day.
Information on these pages contains forward-looking statements that involve risks and uncertainties. Markets and instruments profiled on this page are for informational purposes only and should not in any way come across as a recommendation to buy or sell in these assets. You should do your own thorough research before making any investment decisions. FXStreet does not in any way guarantee that this information is free from mistakes, errors, or material misstatements. It also does not guarantee that this information is of a timely nature. Investing in Open Markets involves a great deal of risk, including the loss of all or a portion of your investment, as well as emotional distress. All risks, losses and costs associated with investing, including total loss of principal, are your responsibility. The views and opinions expressed in this article are those of the authors and do not necessarily reflect the official policy or position of FXStreet nor its advertisers.
