Binance Coin price rally gaining energy, could be set for a blow-off move
|
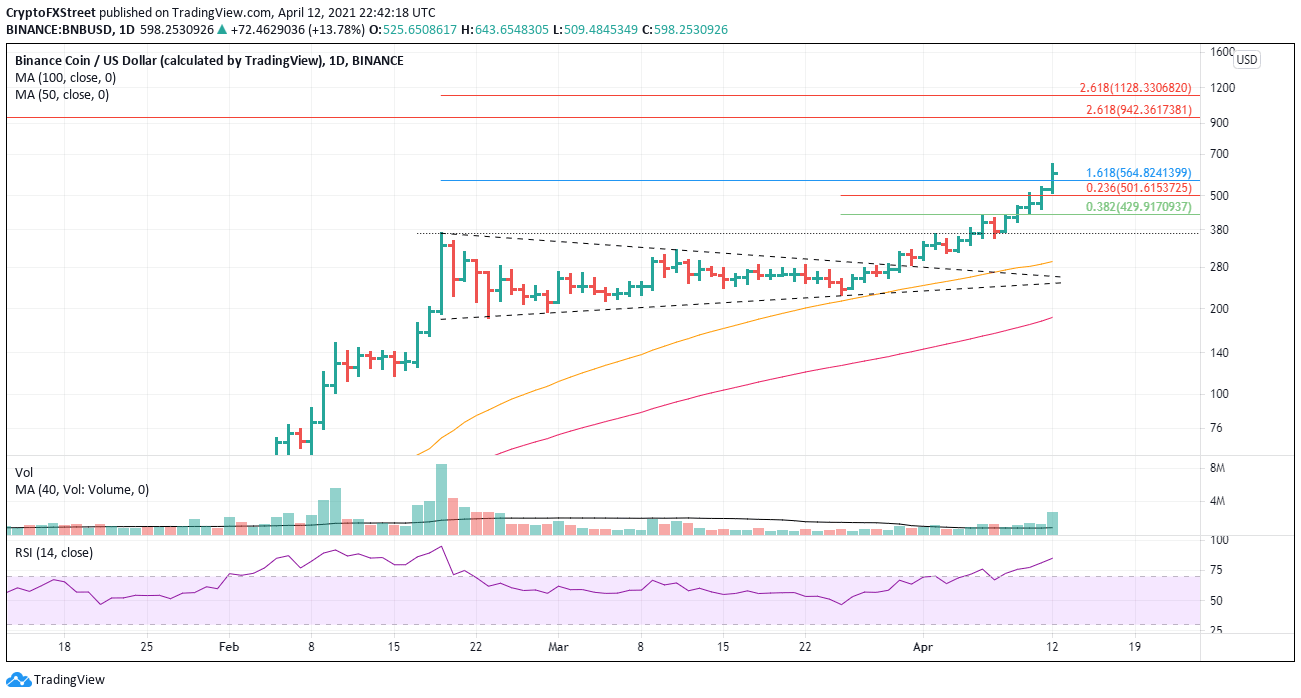
- Binance Coin price extending the symmetrical triangle breakout of March 30.
- New tokenized stock trading service allows users to buy fractions of companies’ shares.
- Largest daily volume since February 21.
Binance Coin price increase in 2021 reflects the rise of BNB from a simple utility token to something much more complex and useful for traders. The token’s momentum is slightly extended on an absolute basis, but relative to the February highs, there is still more upside potential, even for a blow-off move.
Binance Coin price betting BNB can facilitate billions of transactions per day
Today, the cryptocurrency exchange Binance allows users to buy fractions of Tesla shares on their website with no commissions. Users can buy as little as one-hundredth of a Tesla share, with prices settled in Binance USD as expected.
It is not the first tokenized stock play in the cryptocurrency world, as Mirror Protocol started this process in December 2020, as well as other platforms such as Terra and Synthetix. However, there is a big difference. Mirror uses synthetic stocks or tokenized representations of real stocks, while Binance is “backed by a depository portfolio of underlying securities,” which is managed directly by an investment company based in Germany.
Until the end of March, BNB was strongly correlated with Bitcoin, but it is now up almost 130% since the March 30 symmetrical triangle breakout, and BTC is more or less unchanged.
In an FXStreet article on April 6, we projected that the token would consolidate gains in time versus price before resuming the uptrend, and that has been the case. Today, Binance Coin price shredded the 161.8% Fibonacci extension of the brief February correction at $565 and looks positioned to continue the rally to the 261.8% extension of the 2019-2020 bear market at $942, and even to the 261.8% of the February correction at $1,128.
BNB/USD daily chart
A brief consolidation could emerge at any time for the latecomers. Still, based on the indicators and metrics, it should be relatively mild, taking BNB down to the 23.6% retracement of the rally from the March 25 low at $502. The 38.2% retracement at $430 should contain any further weakness
Information on these pages contains forward-looking statements that involve risks and uncertainties. Markets and instruments profiled on this page are for informational purposes only and should not in any way come across as a recommendation to buy or sell in these assets. You should do your own thorough research before making any investment decisions. FXStreet does not in any way guarantee that this information is free from mistakes, errors, or material misstatements. It also does not guarantee that this information is of a timely nature. Investing in Open Markets involves a great deal of risk, including the loss of all or a portion of your investment, as well as emotional distress. All risks, losses and costs associated with investing, including total loss of principal, are your responsibility. The views and opinions expressed in this article are those of the authors and do not necessarily reflect the official policy or position of FXStreet nor its advertisers.
