Axie Infinity price to triple again as AXS coils up in a bullish continuation pattern
|
- Axie Infinity price coils up in a bullish pennant pattern, hinting at a continuation of its uptrend.
- A decisive close above $135 will confirm a breakout and trigger a 222% ascent to $429.23.
- If AXS fails to hold above $114, it will invalidate the bullish thesis.
Axie Infinity price shows affinity to climb higher as it bounces off a crucial support floor. AXS has been consolidating since it hit a new all-time high on October 4, resulting in a continuation pattern.
Axie Infinity price ready for another leg-up
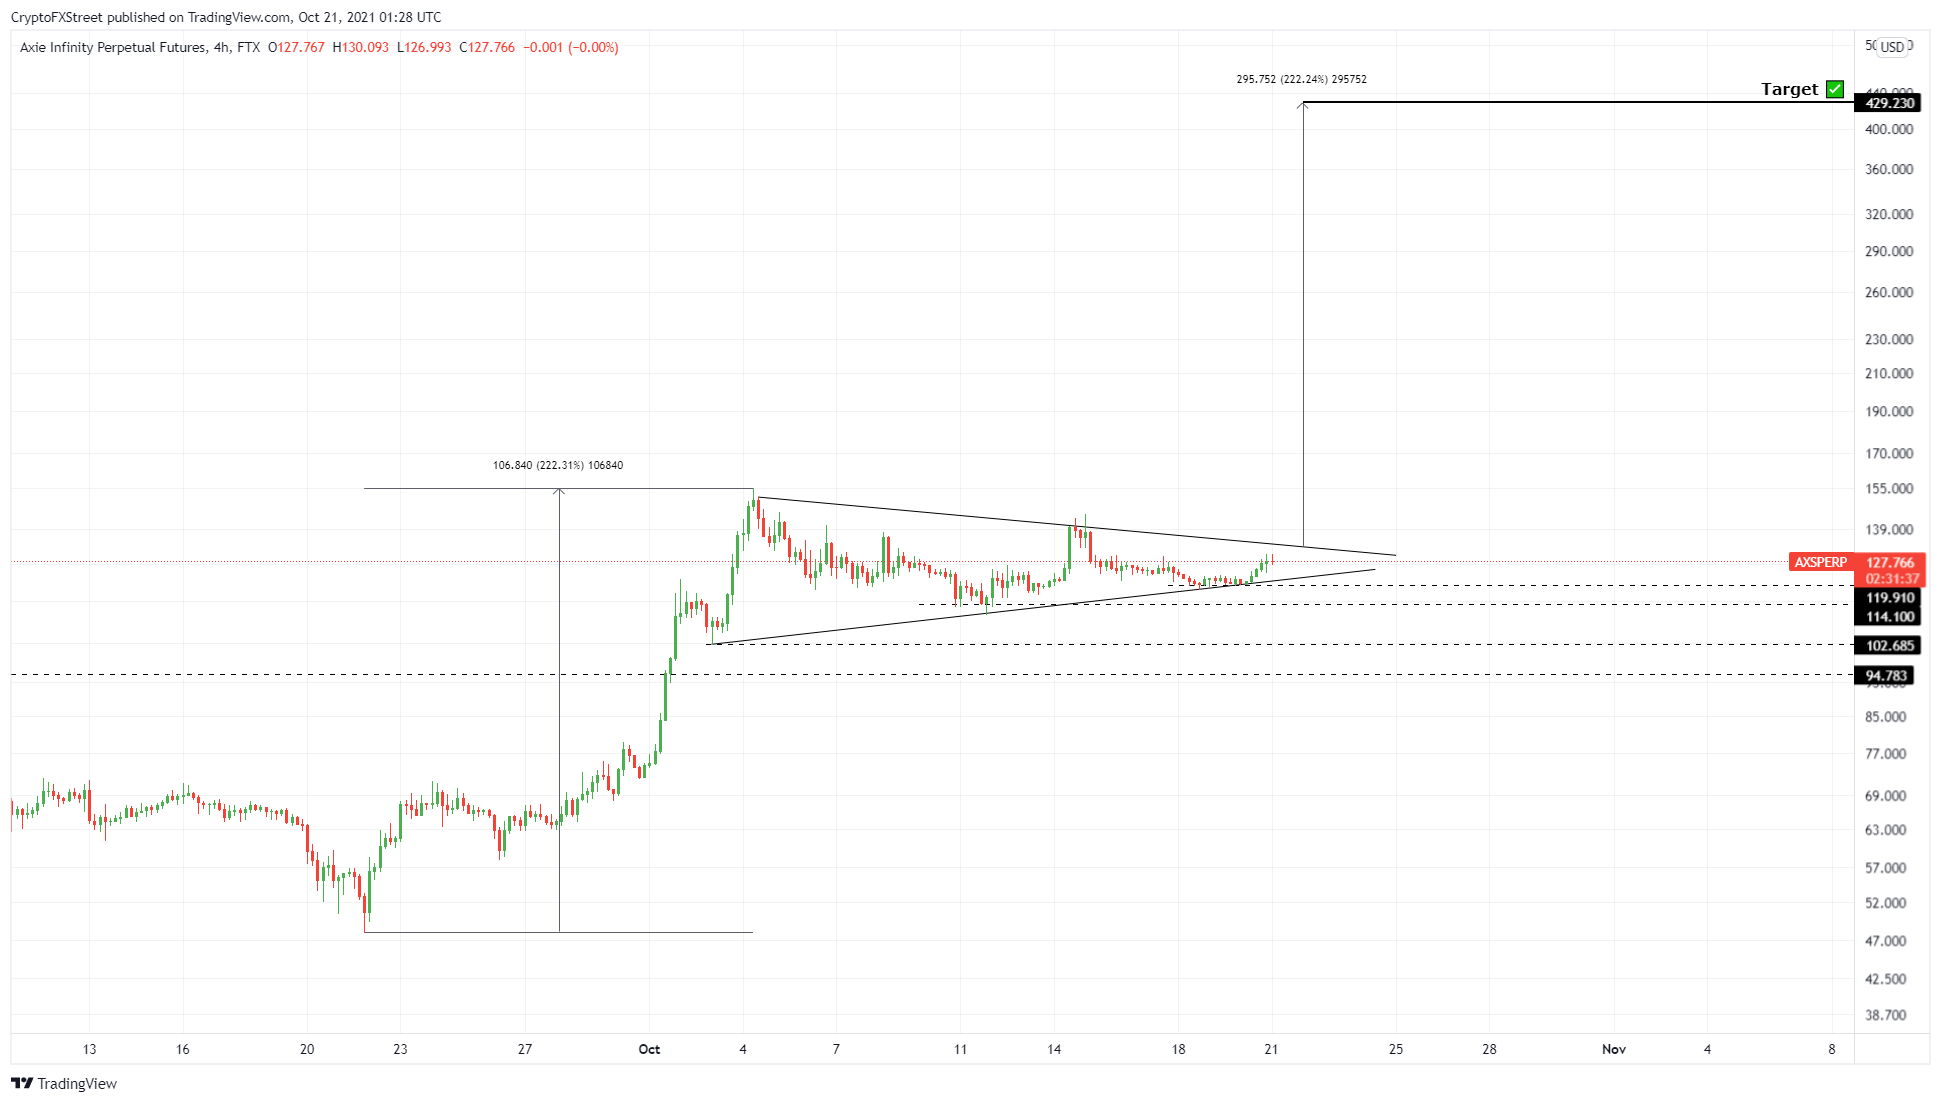
Axie Infinity price rose a whopping 222% between September 21 and October 4 to set up a new all-time high at $154.90. While this ascent is referred to as the flagpole, AXS seemingly slipped into consolidation, which is ongoing.
During this phase, Axie Infinity price created two distinctive lower highs and three higher lows. Connecting these trend lines results in the formation of a pennant.
This technical formation is known as a bullish pennant and is a continuation pattern that forecasts a 222% ascent to $429.23, determined by adding the flagpole’s height to the breakout point at $135.
Although this ascent might seem impossible, investors can expect Axie Infinity price to make pit stops at crucial levels like $300 and $400 before heading toward the intended target.
AXS/USDT 4-hour chart
While things are looking up for Axie Infinity price's formation of a bullish continuation pattern, a failure to slice through $135 will put AXS bulls on the backfoot. Even if AXS manages to slice through the upper trend line, it will have to set up a higher high above its all-time high at $154.9.
If Axie Infinity price fails to do either of these and the resulting pullback produces a lower low below $114.10, it will invalidate the bullish thesis.
In such a case, AXS might venture lower to the $102.69 or $94.78 support levels.
Information on these pages contains forward-looking statements that involve risks and uncertainties. Markets and instruments profiled on this page are for informational purposes only and should not in any way come across as a recommendation to buy or sell in these assets. You should do your own thorough research before making any investment decisions. FXStreet does not in any way guarantee that this information is free from mistakes, errors, or material misstatements. It also does not guarantee that this information is of a timely nature. Investing in Open Markets involves a great deal of risk, including the loss of all or a portion of your investment, as well as emotional distress. All risks, losses and costs associated with investing, including total loss of principal, are your responsibility. The views and opinions expressed in this article are those of the authors and do not necessarily reflect the official policy or position of FXStreet nor its advertisers.

