Avalanche price might need to drop 5% to 10% before AVAX bulls eye retest of $80
Premium|
Take advantage of 50% OFF on your first month.
Start your subscription and get access to all our original articles.
You have reached your limit of 5 free articles for this month.
Get all exclusive analysis, access our analysis and get Gold and signals alerts
Elevate your trading Journey.
UPGRADE- Avalanche price shows signs of exhaustion as it approaches the $51 to $56 resistance zone.
- The bearish divergence developed on the weekly chart forecasts a potential correction.
- The immediate imbalance, extending from $45 to $50, is a good level for long-term buyers to accumulate.
- Invalidation of the bullish thesis will occur on the flip of the $39 support floor into a resistance level.
Avalanche (AVAX) price has been struggling to overcome a critical resistance zone for three weeks now. Considering Bitcoin’s slowdown and sell signs, a potential correction might be due for AVAX in the short term.
Also read: Bitcoin back above $67K as Memecoins push up SOL and AVAX
Avalanche price to provide buying opportunities
Avalanche price overcame the $40 psychological level in late December but rebalanced the $22 to $31 imbalance, allowing sidelined buyers to accumulate. As a result of this buying pressure, AVAX shot up 140% in the under two months.
Between late December and mid-March, Avalanche's price set a higher high. However, the Relative Strength Index (RSI) and the Awesome Oscillator (AO) formed lower highs. This non-conformity is termed bearish divergence and often results in corrective moves for the underlying asset.
In this case, Avalanche price has already shed 19% from the recent local top of $65 and is likely to shed more weight. The immediate imbalance, extending from $45 to $50, is the first accumulation zone, which is roughly 5% to 10% away from the current level of $53.
If history repeats, a dip into this level should generate enough buying pressure to shatter through the $51 to $56 resistance zone and retest the next critical hurdle at $80. This level is the midpoint of the previous bearish market for AVAX.
Read more: Altcoins that show strength during Bitcoin price decline: JUP, SEI, AVAX, GALA and SUI
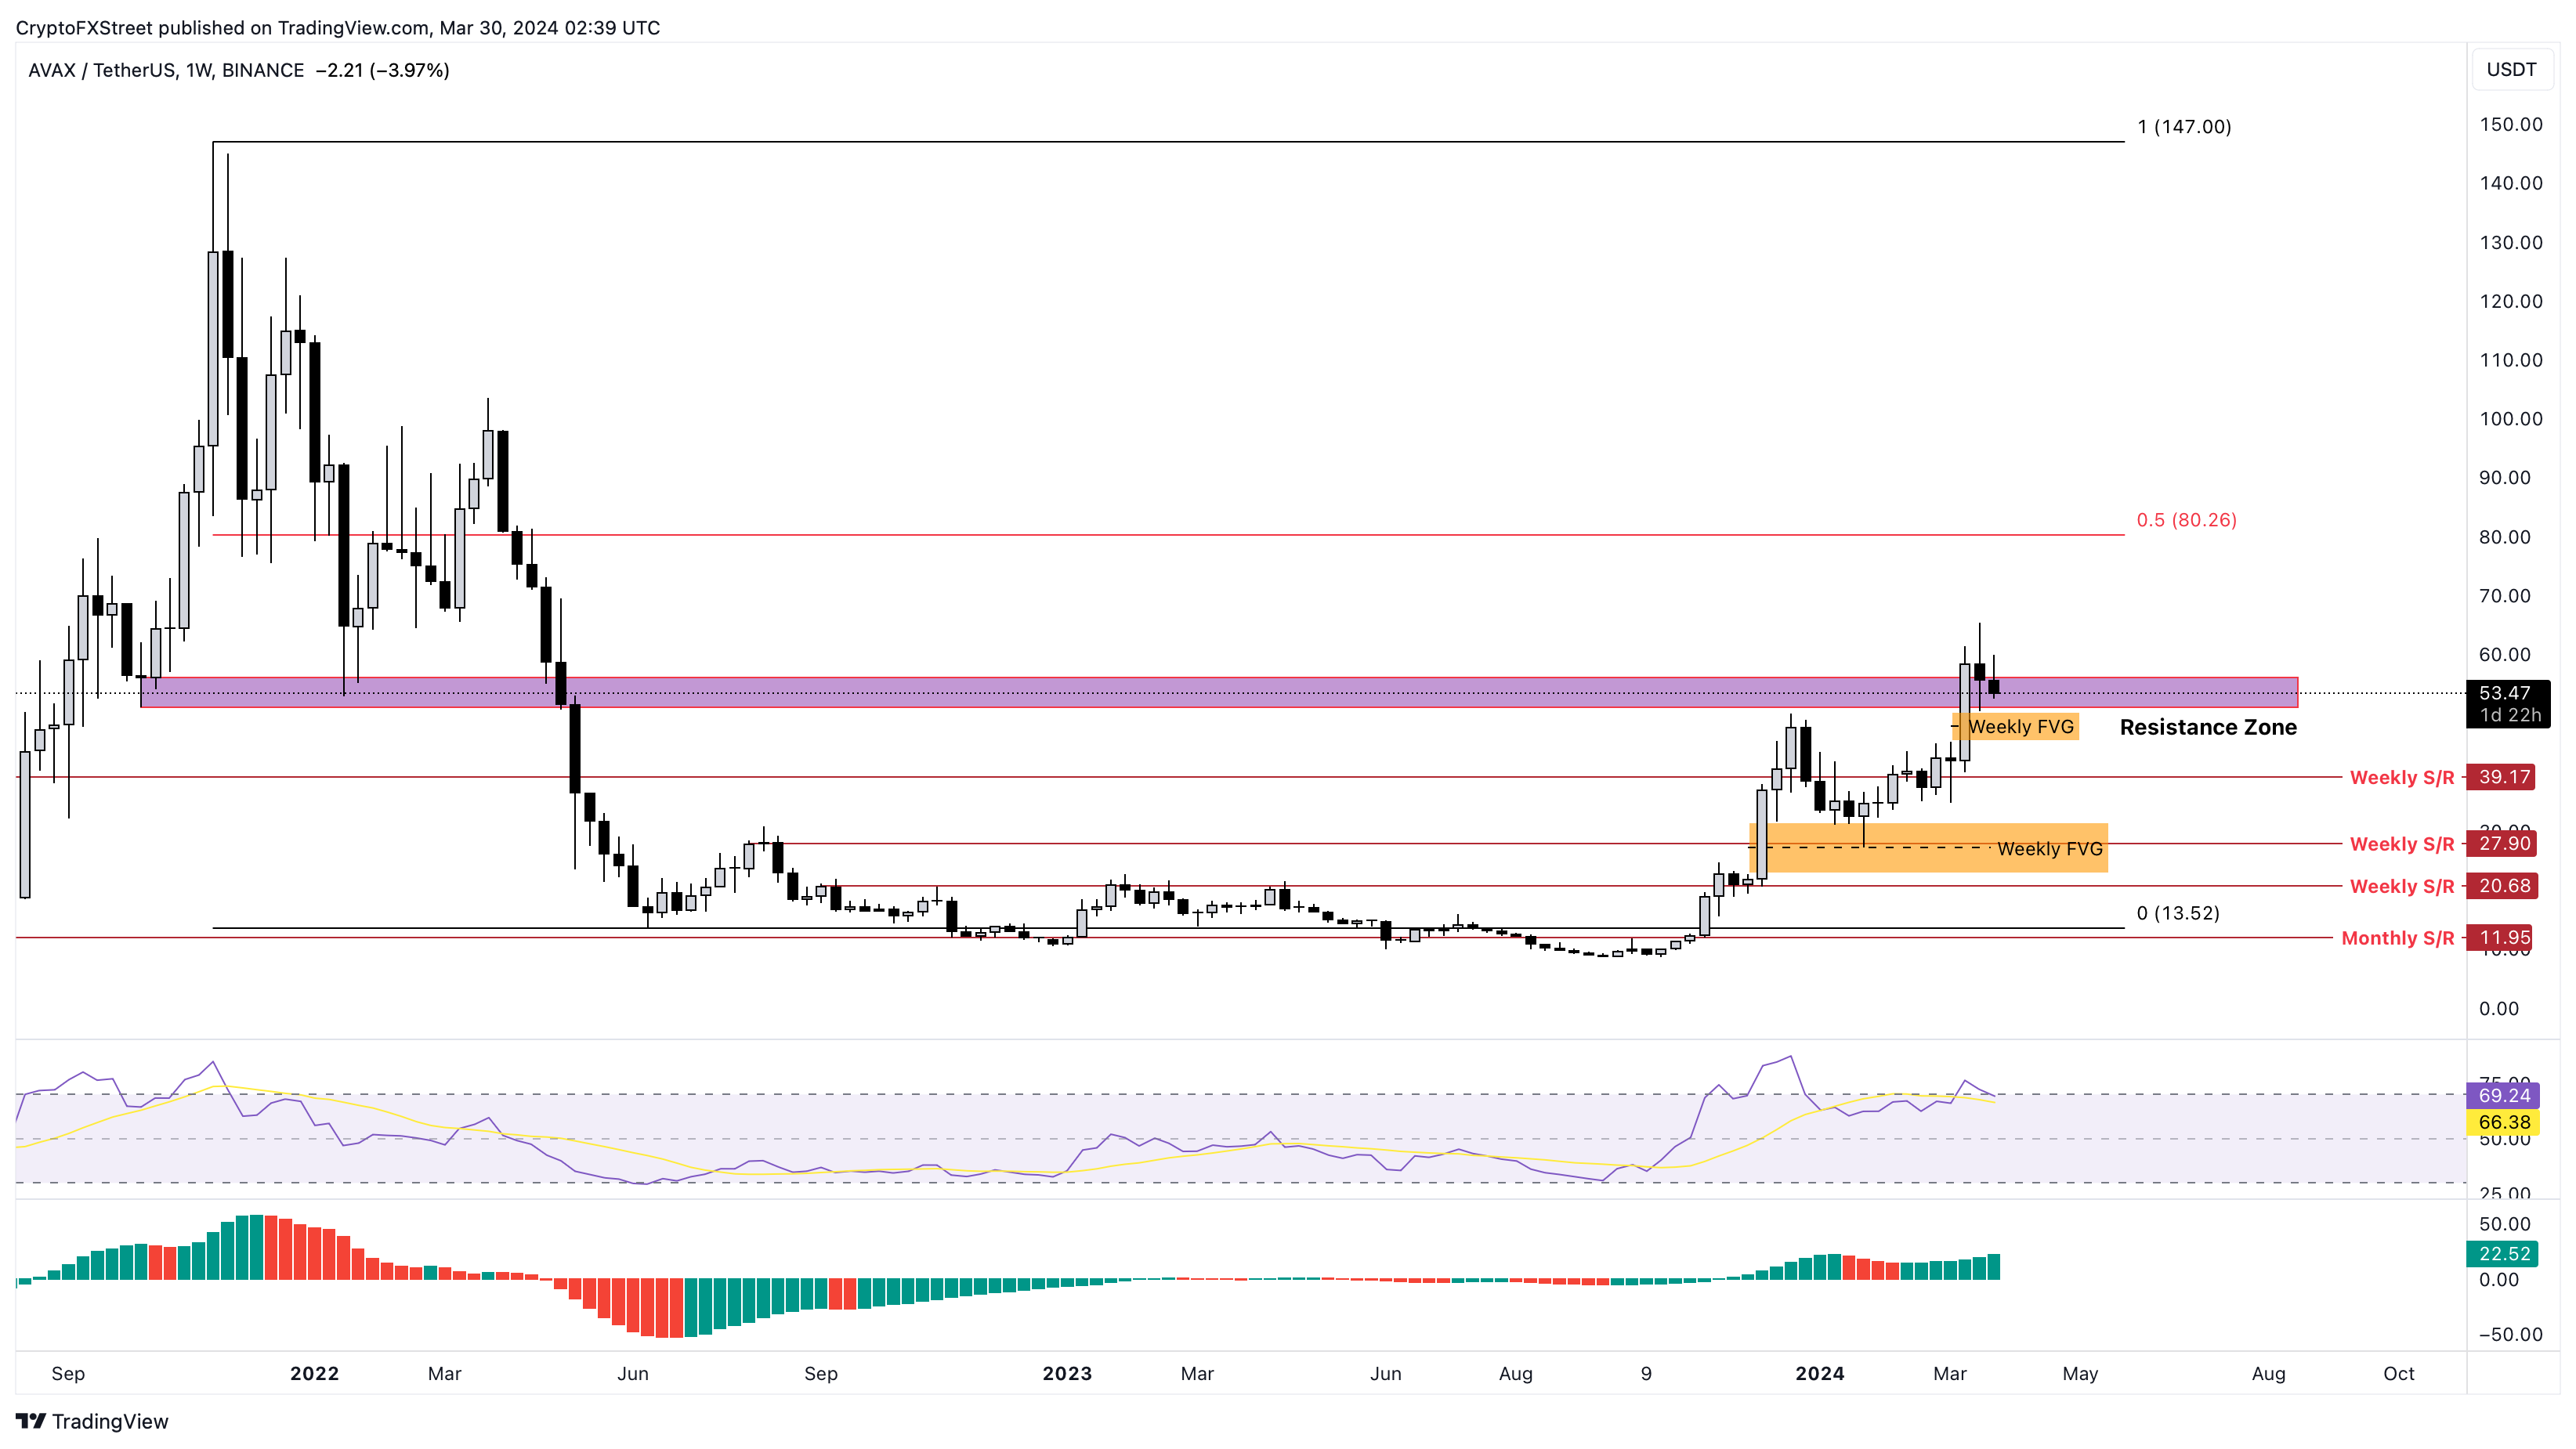
AVAX/USDT 1-week chart
On the other hand, if Avalanche price continues to dip beyond the $45 to $50 imbalance, it would denote a general weakness in the market. In such a case, AVAX will encounter the weekly support level at $40.
If there is a massive spike in selling pressure that pushes Avalanche price to flip the $40 level into a resistance level, it would invalidate the bullish thesis. Such a development could see AVAX crash 28% and tag the next key support level at $28.
Read more: Avalanche Foundation’s meme coin investments are underwater, AVAX price sees 36% weekly gains
- Avalanche price shows signs of exhaustion as it approaches the $51 to $56 resistance zone.
- The bearish divergence developed on the weekly chart forecasts a potential correction.
- The immediate imbalance, extending from $45 to $50, is a good level for long-term buyers to accumulate.
- Invalidation of the bullish thesis will occur on the flip of the $39 support floor into a resistance level.
Avalanche (AVAX) price has been struggling to overcome a critical resistance zone for three weeks now. Considering Bitcoin’s slowdown and sell signs, a potential correction might be due for AVAX in the short term.
Also read: Bitcoin back above $67K as Memecoins push up SOL and AVAX
Avalanche price to provide buying opportunities
Avalanche price overcame the $40 psychological level in late December but rebalanced the $22 to $31 imbalance, allowing sidelined buyers to accumulate. As a result of this buying pressure, AVAX shot up 140% in the under two months.
Between late December and mid-March, Avalanche's price set a higher high. However, the Relative Strength Index (RSI) and the Awesome Oscillator (AO) formed lower highs. This non-conformity is termed bearish divergence and often results in corrective moves for the underlying asset.
In this case, Avalanche price has already shed 19% from the recent local top of $65 and is likely to shed more weight. The immediate imbalance, extending from $45 to $50, is the first accumulation zone, which is roughly 5% to 10% away from the current level of $53.
If history repeats, a dip into this level should generate enough buying pressure to shatter through the $51 to $56 resistance zone and retest the next critical hurdle at $80. This level is the midpoint of the previous bearish market for AVAX.
Read more: Altcoins that show strength during Bitcoin price decline: JUP, SEI, AVAX, GALA and SUI
AVAX/USDT 1-week chart
On the other hand, if Avalanche price continues to dip beyond the $45 to $50 imbalance, it would denote a general weakness in the market. In such a case, AVAX will encounter the weekly support level at $40.
If there is a massive spike in selling pressure that pushes Avalanche price to flip the $40 level into a resistance level, it would invalidate the bullish thesis. Such a development could see AVAX crash 28% and tag the next key support level at $28.
Read more: Avalanche Foundation’s meme coin investments are underwater, AVAX price sees 36% weekly gains
Information on these pages contains forward-looking statements that involve risks and uncertainties. Markets and instruments profiled on this page are for informational purposes only and should not in any way come across as a recommendation to buy or sell in these assets. You should do your own thorough research before making any investment decisions. FXStreet does not in any way guarantee that this information is free from mistakes, errors, or material misstatements. It also does not guarantee that this information is of a timely nature. Investing in Open Markets involves a great deal of risk, including the loss of all or a portion of your investment, as well as emotional distress. All risks, losses and costs associated with investing, including total loss of principal, are your responsibility. The views and opinions expressed in this article are those of the authors and do not necessarily reflect the official policy or position of FXStreet nor its advertisers.