Aptos price is poised for a rally following a retest of the support level
|- Aptos price bounces off the key support zone, eyeing a rally ahead.
- On-chain data paints a bullish picture as APT’s long-to-short ratio is above one, and open interest is rising.
- A daily candlestick close below $7.23 would invalidate the bullish thesis.
Aptos (APT) price extends its gains on Tuesday following last week's retest of its key support zone. On-chain data further support APT’s bullish outlook, as its open interest is rising and long-to-short ratio trades are above one, all hinting at a rally in the upcoming days.
Aptos bulls are ready for an upswing following a bounce from the support zone
Aptos price broke above the falling wedge pattern (formed by connecting multiple highs and lows with two trendlines) on September 21; a break above this pattern generally favors the bulls.
APT retested the breakout level on October 1, which coincides with the 200-day Exponential Moving Average (EMA) at $7.74 and the support zone between $7.35 and $7.76. This zone is a key support level, and it rallied 20%. As of Tuesday, it continues to trade above around $9.02.
If the $7.35 and $7.76 support zone holds, APT could rally 14% from its current trading level to retest its daily resistance level of $10.26.
If the bulls are aggressive, the overall crypto market outlook is positive, and APT closes above $10.26, it could extend an additional rally of 19% to retest its April 12 high of $12.21.
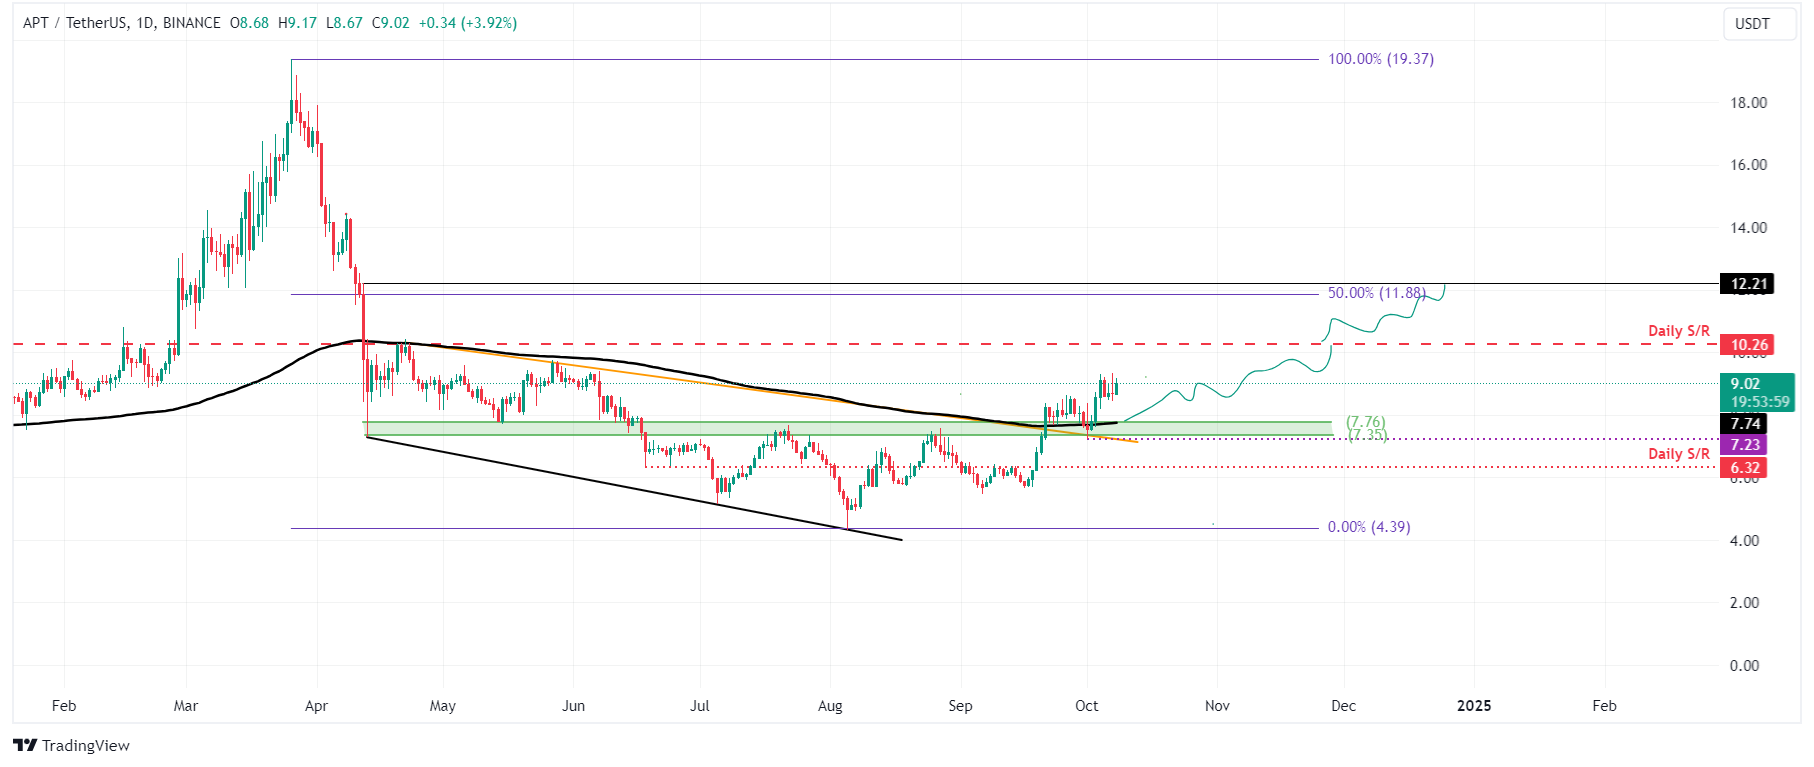
APT/USDT daily chart
Aptos’s on-chain data further supports the bullish thesis. Coinglass’s data shows that the futures’ Open Interest (OI) in Aptos at exchanges is also increasing. The OI indicates the total number of outstanding derivative contracts that have not been settled (offset by delivery) and whether money flows into the contract are increasing or decreasing.
Increasing OI represents new or additional money entering the market and new buying, which suggests a bullish trend. On the contrary, when OI decreases, it is usually a sign that the market is liquidating, more investors are leaving, and prices may decrease.
The graph below shows that APT’s OI increased from $119.23 million on October 2 to $191.84 million on Saturday, the highest level since mid-April. This rise indicates that new or additional money is entering the market and new buying is occurring.
APT Open Interest chart. Source: Coinglass
Coinglass’s long-to-short ratio, at 1.04, is at its highest level in a month, further supporting Aptos's bullish outlook. This ratio above one reflects bullish sentiment in the market, as more traders are betting on the asset price to rise.
APT long-to-short ratio chart. Source: Coinglass
However, if APT’s daily candlestick closes below $7.23, the bullish thesis will be invalidated. This scenario would cause Aptos's price to decline by 12% and retest its next daily support at $6.32.
Information on these pages contains forward-looking statements that involve risks and uncertainties. Markets and instruments profiled on this page are for informational purposes only and should not in any way come across as a recommendation to buy or sell in these assets. You should do your own thorough research before making any investment decisions. FXStreet does not in any way guarantee that this information is free from mistakes, errors, or material misstatements. It also does not guarantee that this information is of a timely nature. Investing in Open Markets involves a great deal of risk, including the loss of all or a portion of your investment, as well as emotional distress. All risks, losses and costs associated with investing, including total loss of principal, are your responsibility. The views and opinions expressed in this article are those of the authors and do not necessarily reflect the official policy or position of FXStreet nor its advertisers.