ApeCoin set for a surge as on-chain and price trends signal a bullish rally
|
- ApeCoin price validated a double-bottom pattern, signaling a bullish move.
- On-chain data paint a bullish picture on APE’s rising open interest, negative exchange flow balance, and decreasing supply on exchanges.
- A daily candlestick close below $0.634 would invalidate the bullish thesis.
ApeCoin (APE) price breakout of the double-bottom formation on Monday and, at the time of writing on Tuesday, trades at $0.847. This pattern signals a potential trend reversal favoring the bulls. Additionally, on-chain data supports this bullish move as APE’s rising open interest, negative exchange floor balance, and decreasing supply on exchanges suggest a rally in ApeCoin's price.
ApeCoin price is set for a rally as it breaks from a double-bottom pattern
ApeCoin price rose and closed at $0.754 at the end of August after bouncing off the $0.550 level. From early August to early September, it formed a W-like structure known as a double-bottom pattern, which often signals a potential trend reversal favoring the bulls. On Monday, ApeCoin's price closed above the neckline at $0.754, and at the time of writing on Tuesday, it trades at $0.847.
If the $0.754 level holds as support, APE could rally 18% from its current trading level to retest the July 1 high of $1.00.
This bullish thesis is supported by indicators like the Relative Strength Index (RSI) and Awesome Oscillator (AO) on the daily chart, both comfortably above their respective neutral levels of 50 and zero. These momentum indicators strongly indicate bullish dominance.
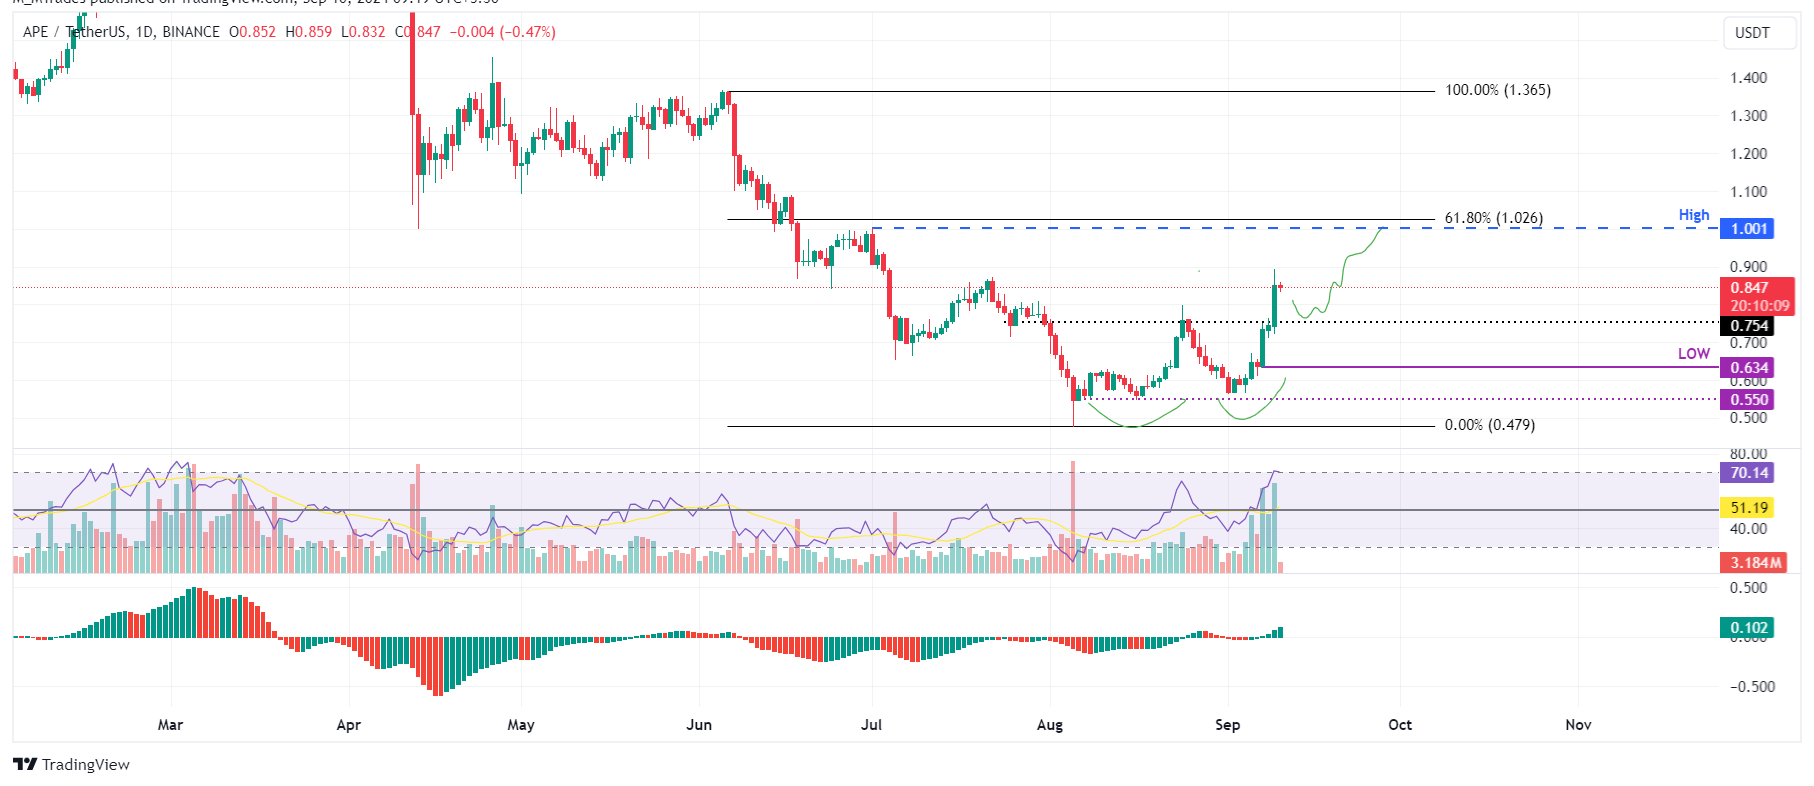
APE/USDT daily chart
Coinglass’s data shows that the futures’ Open Interest (OI) in Apecoin at exchanges is also increasing. The OI indicates the total number of outstanding derivative contracts that have not been settled (offset by delivery) and whether money flows into the contract are increasing or decreasing.
Increasing OI represents new or additional money entering the market and new buying, which suggests a bullish trend. When OI decreases, it is usually a sign that the market is liquidating, more investors are leaving, and the current price trend is ending.
The graph below shows that APE’s OI increased from $31.41 million on Saturday to $54.96 million on Tuesday, indicating that new or additional money is entering the market and new buying is occurring.
APE Open Interest chart
Santiment’s Exchange Flow Balance shows the net movement of APE tokens into and out of exchange wallets. A positive value indicates more tokens entered into the exchanges than exits, suggesting selling pressure from investors. Conversely, a negative value indicates more tokens left the exchange than entered, indicating less selling pressure from investors.
In APE’s case, the Exchange Flow balance slumped from 4.59 million to -2.60 from September 2 to September 5 and -47,190 to -1.8 million from Saturday to Monday. This negative spike indicates increased investor confidence. APE’s Supply on Exchanges declined by 6.16% during the same period. This is a bullish development, further denoting investor confidence in ApeCoin.
APE Exchange Flow Balance and Supply on Exchanges chart
Despite the bullish thesis signaled by both on-chain data and technical analysis, the outlook will shift to bearish if ApeCoin's daily candlestick closes below the September 7 low of $0.634. This scenario could lead to a 13% crash to retest its daily support at $0.550.
Information on these pages contains forward-looking statements that involve risks and uncertainties. Markets and instruments profiled on this page are for informational purposes only and should not in any way come across as a recommendation to buy or sell in these assets. You should do your own thorough research before making any investment decisions. FXStreet does not in any way guarantee that this information is free from mistakes, errors, or material misstatements. It also does not guarantee that this information is of a timely nature. Investing in Open Markets involves a great deal of risk, including the loss of all or a portion of your investment, as well as emotional distress. All risks, losses and costs associated with investing, including total loss of principal, are your responsibility. The views and opinions expressed in this article are those of the authors and do not necessarily reflect the official policy or position of FXStreet nor its advertisers.